TEKS Math 8.5.H
The Standard
identify examples of proportional and non-proportional functions that arise from mathematical and real-world problems
Texas Essential Knowledge and Skills for Mathematics
Teacher's field guide
What This Standard Means
What Students Need to Do
- Students decide whether a function shows a constant multiplicative relationship. They use tables, graphs, equations, and real-world situations to identify proportional and non-proportional examples.
What Mastery Looks Like
- Students correctly classify functions shown as tables, graphs, equations, or situations. They justify proportional relationships using a constant ratio, an equation in the form y = kx, or a graph through the origin.
Common Misconceptions
- Students may call any straight-line graph proportional, even when it does not pass through the origin. They may compare differences instead of ratios, or assume a real-world relationship is proportional because both quantities increase.
How to Assess It
- Give students a table with points (0, 3), (2, 7), and (4, 11). Ask them to classify the function and justify their answer with two pieces of evidence.
Lesson moves
Ways to Teach It
Give groups cards showing tables, graphs, equations, and situations, then have them sort each card into proportional or non-proportional groups.
Ask students to explain why y = 4x is proportional but y = 4x + 2 is not, using graphs and ratios.
Play a classification relay where teams analyze one function card, record evidence, and pass the next card to another teammate.
Compare a taxi fare with a starting fee to pay based only on miles, then decide which pricing plan is proportional.
Free download
Printable 8.5.H Worksheet
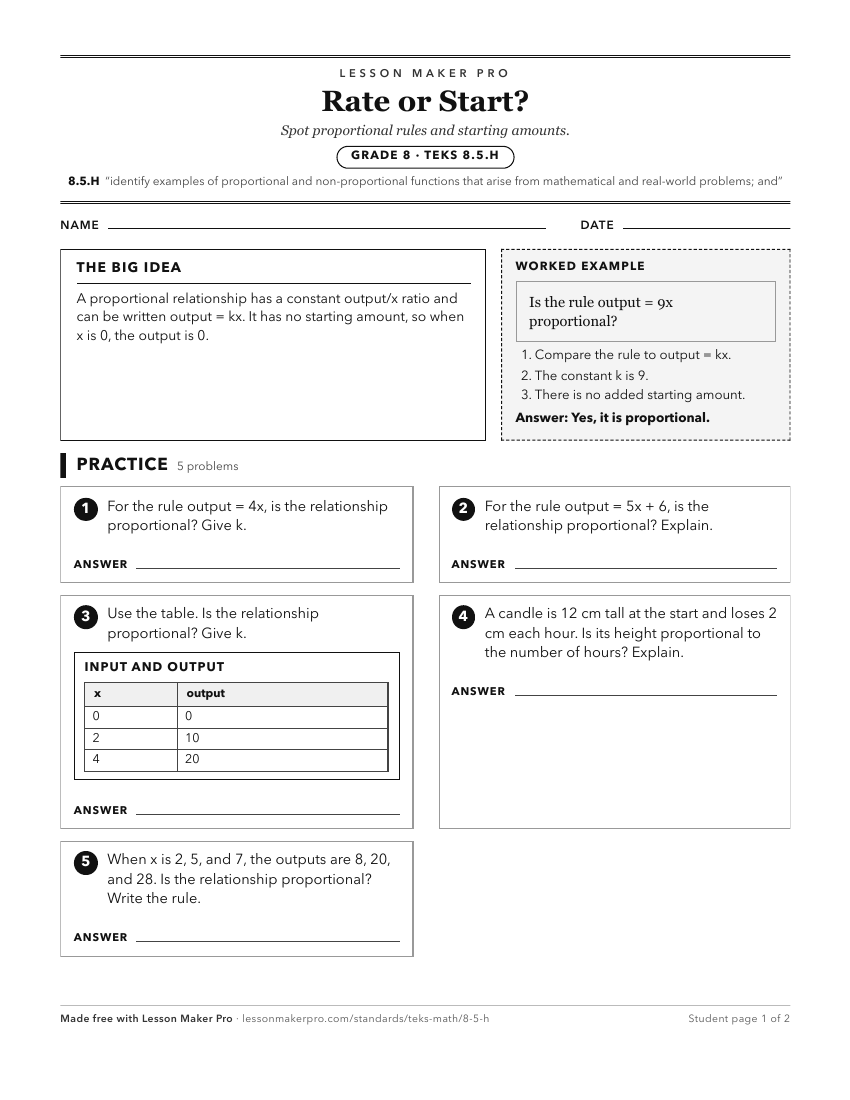
A ready-to-print activity worksheet aligned to 8.5.H, with an answer key for the teacher on its own page. No account needed.
PDF, US Letter, prints cleanly in black and white.
Download the worksheetKeep exploring
Related Standards
- 7.4
The student applies mathematical process standards to represent and solve problems involving proportional relationships
- 6.5.A
represent mathematical and real-world problems involving ratios and rates using scale factors, tables, graphs, and proportions
- 8.5
The student applies mathematical process standards to use proportional and non-proportional relationships to develop foundational concepts of functions
- 6.5
The student applies mathematical process standards to solve problems involving proportional relationships
Turn this exact standard into a lesson
Grade, subject, topic, and the complete standard are prefilled. Create one free, no account needed.
Also for this standard:Make a WorksheetMake a QuizMake a Sub Lesson