Georgia 7.PAR.4
Georgia Standard (Expectation Cluster)
Recognize proportional relationships in relevant, mathematical problems; represent, solve, and explain these relationships with tables, graphs, and equations.
Georgia's K-12 Mathematics Standards
Cluster contents
Expectations in This Standard
7.PAR.4 is a Georgia mathematics standard. These are the expectations under it.
- 7.PAR.4.1
Compute unit rates associated with ratios of fractions, including ratios of lengths, areas and other quantities measured in like or different units presented in...
- 7.PAR.4.10
Predict characteristics of a population by examining the characteristics of a representative sample. Recognize the potential limitations and scope of the sample...
- 7.PAR.4.11
Analyze sampling methods and conclude that random sampling produces and supports valid inferences.
- 7.PAR.4.12
Use data from repeated random samples to evaluate how much a sample mean is expected to vary from a population mean. Simulate multiple samples of the same size.
- 7.PAR.4.2
Determine the unit rate (constant of proportionality) in tables, graphs (1, r), equations, diagrams, and verbal descriptions of proportional relationships to so...
- 7.PAR.4.3
Determine whether two quantities presented in authentic problems are in a proportional relationship.
- 7.PAR.4.4
Identify, represent, and use proportional relationships.
- 7.PAR.4.5
Use context to explain what a point (x, y) on the graph of a proportional relationship means in terms of the situation, with special attention to the points (0,...
- 7.PAR.4.6
Solve everyday problems involving scale drawings of geometric figures, including computing actual lengths and areas from a scale drawing and reproducing a scale...
- 7.PAR.4.7
Use similar triangles to explain why the slope, m, is the same between any two distinct points on a nonvertical line in the coordinate plane.
- 7.PAR.4.8
Graph proportional relationships, interpreting the unit rate as the slope of the graph. Compare two different proportional relationships represented in differen...
- 7.PAR.4.9
Use proportional relationships to solve multi-step ratio and percent problems presented in applicable situations.
Teacher's field guide
What This Cluster Means
What Students Need to Do
- Students decide whether two quantities have a constant ratio. They represent the relationship in tables, graphs, and equations such as y = kx. They use these forms to solve problems and explain their reasoning.
What Mastery Looks Like
- Students can identify the constant of proportionality and use it to find missing values. They can connect a table, graph, equation, and situation, then explain why the relationship is proportional.
Common Misconceptions
- Students may look for a constant difference instead of a constant ratio. They may assume every straight-line graph is proportional, even when it does not pass through the origin. They may reverse the ratio when finding the constant of proportionality.
How to Assess It
- Give students the table x: 2, 4, 7 and y: 5, 10, 17.5. Ask them to decide whether it is proportional, write an equation, and sketch the graph.
Lesson moves
Ways to Teach It
Use measuring cups to make drink batches with one scoop per two cups of water, then record, graph, and write an equation.
Discuss two plans, $3 per ticket and a $3 fee plus $2 per ticket, and explain which relationship is proportional.
Run a card sort matching proportional tables, graphs, equations, and context cards, with students correcting any unmatched distractors.
Use grocery ads to compare cost and quantity, calculate unit prices, and model each proportional relationship with an equation.
Free download
Printable 7.PAR.4 Worksheet
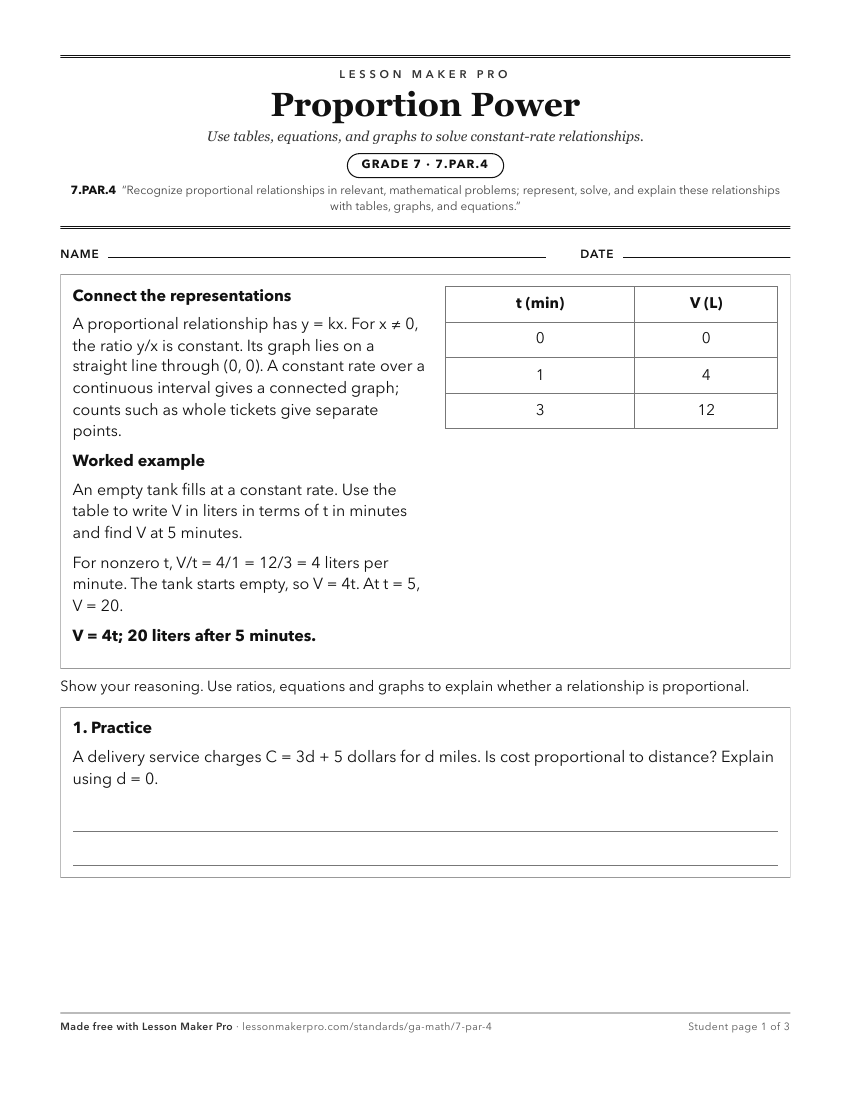
A ready-to-print activity worksheet aligned to 7.PAR.4, with an answer key for the teacher on its own page. No account needed.
PDF, US Letter, prints cleanly in black and white.
Download the worksheetKeep exploring
Related Standards
- 6.NR.4
Solve a variety of contextual problems involving ratios, unit rates, equivalent ratios, percentages, and conversions within measurement systems using proportion...
- 8.PAR.4
Show and explain the connections between proportional and non-proportional relationships, lines, and linear equations; create and interpret graphical mathematic...
Turn this cluster into a lesson
Grade, subject, topic, and the complete cluster are prefilled. Create one free, no account needed.
Also for this cluster:Make a WorksheetMake a QuizMake a Sub Lesson