Georgia 7.PAR.4.11
The Standard
Analyze sampling methods and conclude that random sampling produces and supports valid inferences.
Georgia's K-12 Mathematics Standards · Recognize proportional relationships in relevant, mathematical problems; represent, solve, and explain these relationships with tables, graphs, and equations.
Teacher's field guide
What This Standard Means
What Students Need to Do
- Students examine how a sample was selected and decide whether it fairly represents a larger population. They use the sampling method to judge whether a conclusion is reasonable.
What Mastery Looks Like
- Students identify the population, sample, and selection method in a scenario. They explain whether bias is likely and whether the sample supports a claim about the population.
Common Misconceptions
- Students may think random means choosing people without a clear plan. They may assume a large sample is always fair. They may also treat convenience or voluntary response samples as representative.
How to Assess It
- Exit ticket: A coach surveys the first 20 students entering school about a new lunch menu. Ask whether the results represent the whole school and how to improve the sample.
Lesson moves
Ways to Teach It
Place colored counters in a bag, draw a random sample, and compare its color proportions with the full bag.
Discuss: Would surveying only basketball players fairly measure student support for a longer lunch period? Explain your answer.
Sort scenario cards into random, biased, or unclear samples, then earn points by defending each choice.
Plan a schoolwide survey about homework time, including a specific method for randomly selecting students from all grade levels.
Free download
Printable 7.PAR.4.11 Worksheet
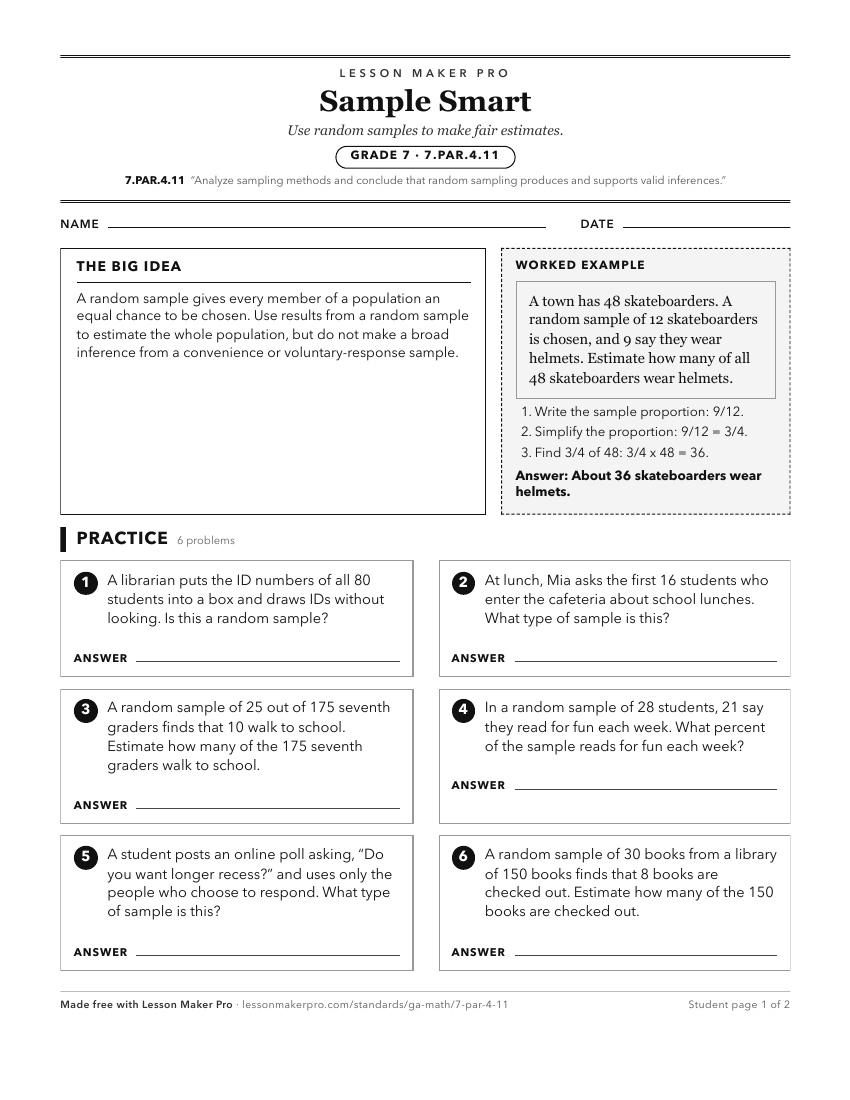
A ready-to-print activity worksheet aligned to 7.PAR.4.11, with an answer key for the teacher on its own page. No account needed.
PDF, US Letter, prints cleanly in black and white.
Download the worksheetKeep exploring
Related Standards
- 8.FGR.6.4
Use appropriate graphical displays from data distributions involving lines of best fit to draw informal inferences and answer the statistical investigative ques...
- 7.PAR.4.10
Predict characteristics of a population by examining the characteristics of a representative sample. Recognize the potential limitations and scope of the sample...
- 7.PAR.4.12
Use data from repeated random samples to evaluate how much a sample mean is expected to vary from a population mean. Simulate multiple samples of the same size.
- 7.PR.6.6
Use appropriate graphical displays and numerical summaries from data distributions with categorical or quantitative (numerical) variables as probability models ...
Turn this exact standard into a lesson
Grade, subject, topic, and the complete standard are prefilled. Create one free, no account needed.
Also for this standard:Make a WorksheetMake a QuizMake a Sub Lesson