Georgia 8.FGR.6.4
The Standard
Use appropriate graphical displays from data distributions involving lines of best fit to draw informal inferences and answer the statistical investigative question posed in an unbiased statistical study.
Georgia's K-12 Mathematics Standards · Solve practical, linear problems involving situations using bivariate quantitative data.
Teacher's field guide
What This Standard Means
What Students Need to Do
- Students choose or create a scatter plot for two quantitative variables, then use a reasonable line of best fit to describe the pattern. They answer the investigation question with an informal inference that fits the data and the study’s sampling limits.
What Mastery Looks Like
- A student identifies direction, strength, and unusual points, then draws a line through the center of the data. The student makes a sensible estimate, states a conclusion in context, and avoids claiming causation or generalizing beyond the sampled group.
Common Misconceptions
- Students may connect the points, force the line through the origin, or draw it toward an outlier instead of balancing the data cloud. They may treat association as causation, predict far beyond the data range, or generalize from a biased sample.
How to Assess It
- Give students a scatter plot from a random sample showing study time and quiz score, with a best-fit line. Ask, “Estimate the score for 3 hours, describe the association, and state one conclusion the data supports but does not prove.”
Lesson moves
Ways to Teach It
Measure classmates’ arm spans and heights, make a scatter plot, draw a best-fit line, and state one inference limited to the class.
Compare two plots of the same data using different scales, then write which display supports a fairer conclusion and why.
Match data cards to scatter plots and best-fit lines, then earn a point by answering the investigation question without overstating the evidence.
Use a public weather dataset to examine temperature and electricity use, then explain what the trend could help a utility predict.
Free download
Printable 8.FGR.6.4 Worksheet
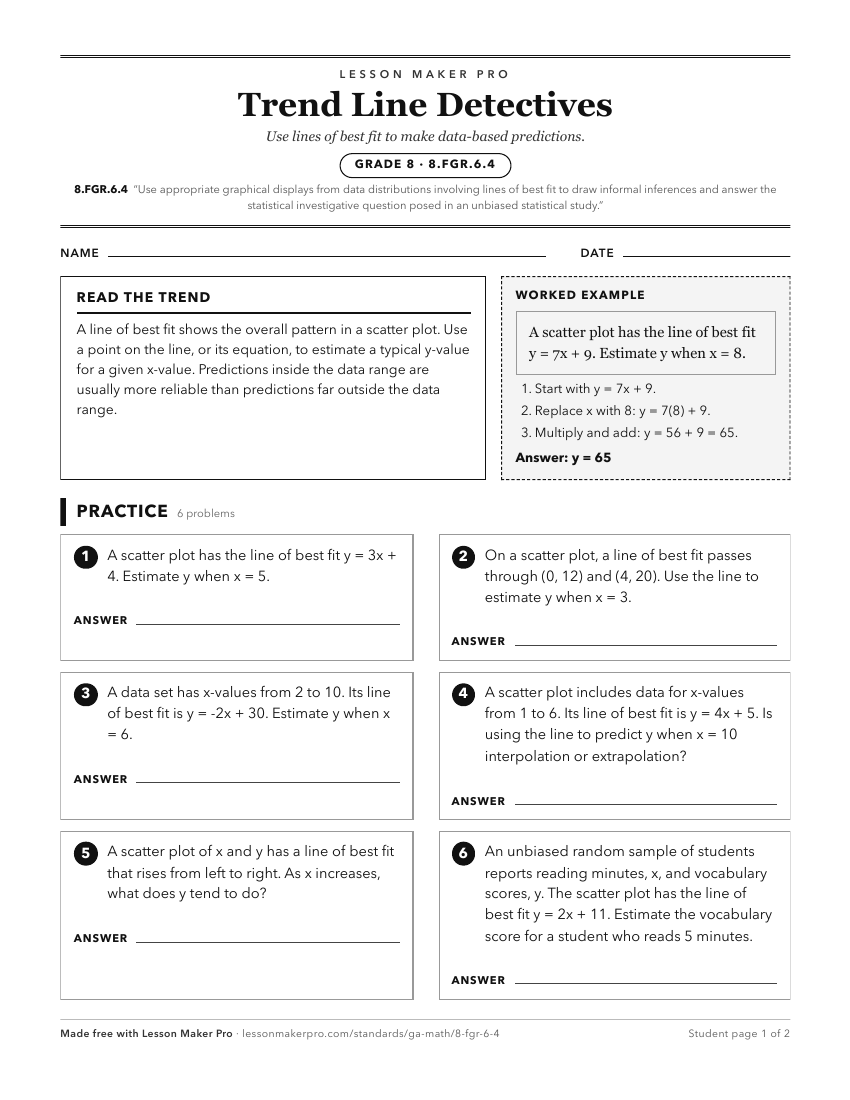
A ready-to-print activity worksheet aligned to 8.FGR.6.4, with an answer key for the teacher on its own page. No account needed.
PDF, US Letter, prints cleanly in black and white.
Download the worksheetKeep exploring
Related Standards
- 6.NR.2.3
Interpret numerical data to answer a statistical investigative question created. Describe the distribution of a quantitative (numerical) variable collected, inc...
- 7.PR.6.6
Use appropriate graphical displays and numerical summaries from data distributions with categorical or quantitative (numerical) variables as probability models ...
- 8.FGR.6.1
Show that straight lines are widely used to model relationships between two quantitative variables. For scatter plots that suggest a linear association, visuall...
- 4.MDR.6.2
Ask questions and answer them based on gathered information, observations, and appropriate graphical displays to solve problems relevant to everyday life.
Turn this exact standard into a lesson
Grade, subject, topic, and the complete standard are prefilled. Create one free, no account needed.
Also for this standard:Make a WorksheetMake a QuizMake a Sub Lesson