Georgia 8.FGR.6.1
The Standard
Show that straight lines are widely used to model relationships between two quantitative variables. For scatter plots that suggest a linear association, visually fit a straight line, and informally assess the model fit by judging the closeness of the data points to the line of best fit.
Georgia's K-12 Mathematics Standards · Solve practical, linear problems involving situations using bivariate quantitative data.
Teacher's field guide
What This Standard Means
What Students Need to Do
- Students inspect a scatter plot and decide whether one straight line reasonably represents the pattern. They draw a visual trend line and judge its fit by checking point distances and balance around the line.
What Mastery Looks Like
- A student draws a line through the center of the data trend, with points reasonably balanced above and below it. The student compares plots or possible lines and explains that smaller gaps from the line indicate a better fit.
Common Misconceptions
- Students may connect every point instead of drawing one line through the overall pattern. They may force the line through the origin or judge fit only by how many points touch it. Some ignore outliers or place nearly all points on one side of the line.
How to Assess It
- Give students one scatter plot and ask them to draw a trend line. Have them judge the fit in one sentence using point distances and balance above and below the line.
Lesson moves
Ways to Teach It
Measure classmates’ heights and arm spans, plot the ordered pairs on chart paper, then use string to test possible trend lines.
Compare two lines drawn on the same scatter plot and write which fits better, citing point closeness and balance above and below.
Run a Line Fit Challenge where teams draw models on identical scatter plots, then earn points for small visual gaps.
Plot daily temperature and ice cream sales from a small data table, fit a line, and explain whether the model seems useful.
Free download
Printable 8.FGR.6.1 Worksheet
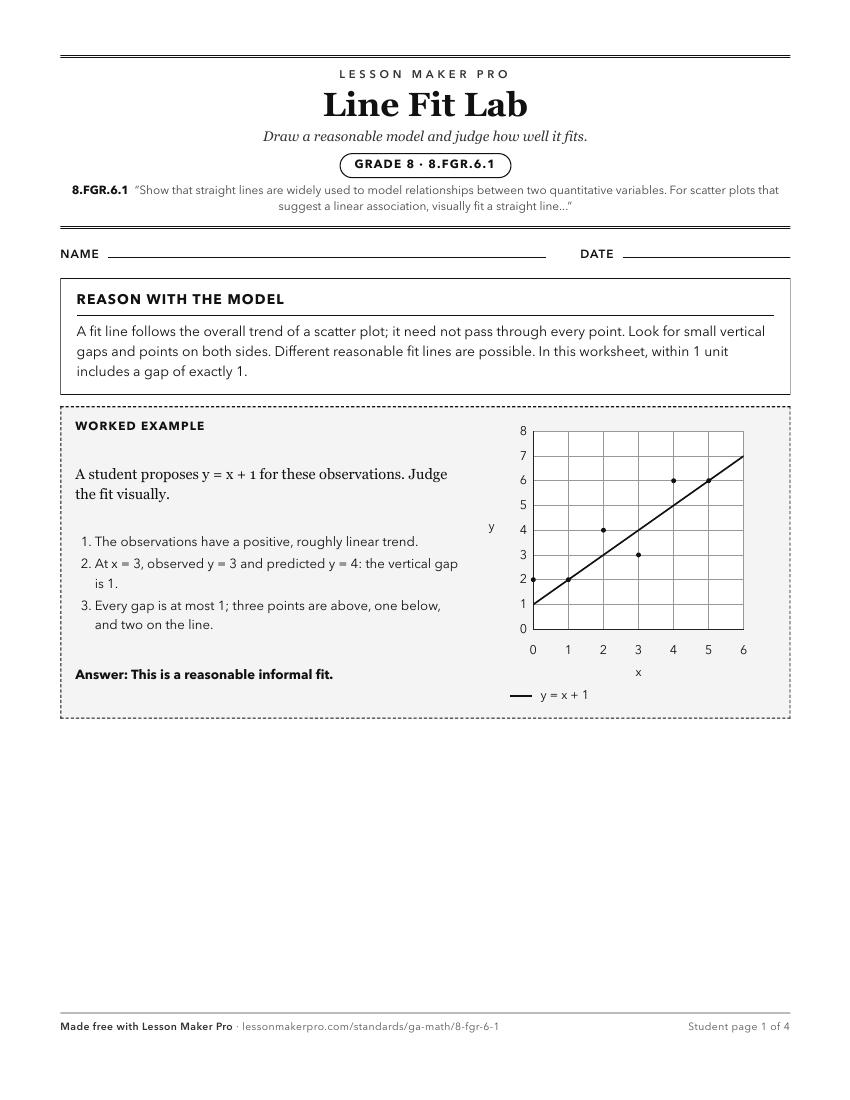
A ready-to-print activity worksheet aligned to 8.FGR.6.1, with an answer key for the teacher on its own page. No account needed.
PDF, US Letter, prints cleanly in black and white.
Download the worksheetKeep exploring
Related Standards
- 8.PAR.4
Show and explain the connections between proportional and non-proportional relationships, lines, and linear equations; create and interpret graphical mathematic...
- 8.FGR.6.4
Use appropriate graphical displays from data distributions involving lines of best fit to draw informal inferences and answer the statistical investigative ques...
- 8.FGR.5.7
Construct a function to model a linear relationship between two quantities. Determine the rate of change and initial value of the function from a description of...
- 8.FGR.6.2
Use the equation of a linear model to solve problems in the context of bivariate measurement data, interpreting the slope and intercepts.
Turn this exact standard into a lesson
Grade, subject, topic, and the complete standard are prefilled. Create one free, no account needed.
Also for this standard:Make a WorksheetMake a QuizMake a Sub Lesson