Georgia 8.FGR.5.7
The Standard
Construct a function to model a linear relationship between two quantities. Determine the rate of change and initial value of the function from a description of a relationship or from two (x,y) values, including reading these from a table or from a graph.
Georgia's K-12 Mathematics Standards · Describe the properties of functions to define, evaluate, and compare relationships, and use functions and graphs of functions to model and explain real phenomena.
Teacher's field guide
What This Standard Means
What Students Need to Do
- Students represent a constant-rate relationship with an equation such as y = mx + b. They calculate the rate from two points, find the initial value, and explain both values in context.
What Mastery Looks Like
- Given a story, table, graph, or two points, a student writes the correct linear equation. The student identifies the rate and initial value, includes units, and checks that the equation fits the given information.
Common Misconceptions
- Students may reverse the subtraction order, use y divided by x instead of change in y divided by change in x, or assume every table is linear. They may confuse the initial value with the first listed output, especially when x = 0 is not shown.
How to Assess It
- Exit ticket: A bike rental costs $8 upfront and $3 per hour. Write C(h), state the rate and initial value, and find C(5).
Lesson moves
Ways to Teach It
Students plot two points on grid paper, draw the line, and use rise and run to write its equation.
Ask students to explain in writing how two points reveal both the rate and initial value of a linear function.
Run a card sort matching linear stories, tables, graphs, equations, rates, and initial values.
Use a taxi base fee and per-mile charge to build an equation and predict fares for several trips.
Free download
Printable 8.FGR.5.7 Worksheet
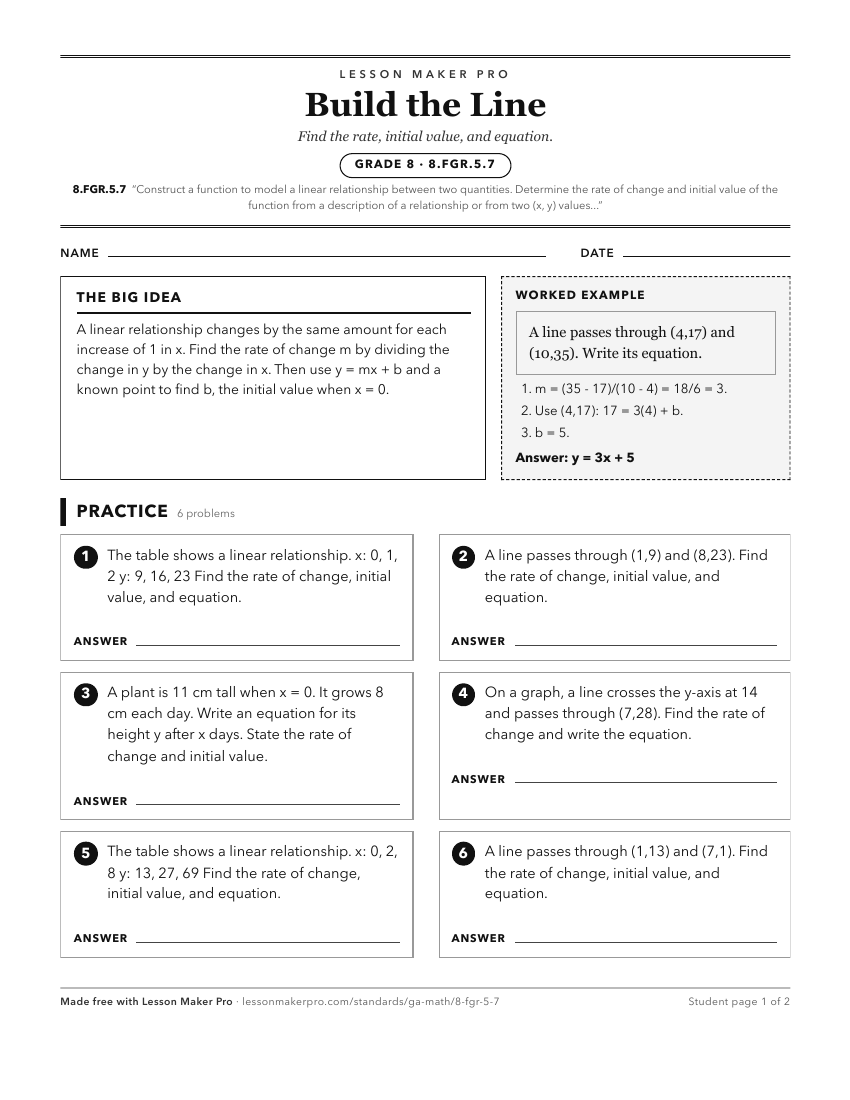
A ready-to-print activity worksheet aligned to 8.FGR.5.7, with an answer key for the teacher on its own page. No account needed.
PDF, US Letter, prints cleanly in black and white.
Download the worksheetKeep exploring
Related Standards
- 7.PAR.4.8
Graph proportional relationships, interpreting the unit rate as the slope of the graph. Compare two different proportional relationships represented in differen...
- 8.FGR.5.2
Within realistic situations, identify and describe examples of functions that are linear or nonlinear. Sketch a graph that exhibits the qualitative features of ...
- 8.FGR.5.4
Compare properties (rate of change and initial value) of two functions used to model an authentic situation each represented in a different way (algebraically, ...
- 8.FGR.5.8
Explain the meaning of the rate of change and initial value of a linear function in terms of the situation it models, and in terms of its graph or a table of va...
Turn this exact standard into a lesson
Grade, subject, topic, and the complete standard are prefilled. Create one free, no account needed.
Also for this standard:Make a WorksheetMake a QuizMake a Sub Lesson