Georgia 8.FGR.5.2
The Standard
Within realistic situations, identify and describe examples of functions that are linear or nonlinear. Sketch a graph that exhibits the qualitative features of a function that has been described verbally.
Georgia's K-12 Mathematics Standards · Describe the properties of functions to define, evaluate, and compare relationships, and use functions and graphs of functions to model and explain real phenomena.
Teacher's field guide
What This Standard Means
What Students Need to Do
- Students decide whether a real situation has a constant or changing rate and explain why it is linear or nonlinear. They turn verbal descriptions into graph sketches showing how quantities rise, fall, or stay constant.
What Mastery Looks Like
- Students classify relationships from situations, tables, or graphs and support the choice with evidence about rate of change. Their sketches have labeled axes and accurately show rising, falling, flat, and turning sections.
Common Misconceptions
- Students may call every increasing relationship linear or think a negative slope means nonlinear. They may draw a picture of the situation instead of a graph, or ignore flat sections and changing rates.
How to Assess It
- Give this prompt: “A pool fills steadily, stays at the same level, then drains faster over time.” Students classify the relationship and sketch water level against time.
Lesson moves
Ways to Teach It
Pour water steadily into a straight cup and a cone-shaped cup, recording and graphing water height every ten seconds.
Ask students to explain why an increasing graph can be nonlinear, using a specific example and a labeled sketch.
Play a matching game with situation cards and graph cards, then require partners to justify each match using rate of change.
Track phone battery percentage across a school day, then sketch and explain periods of steady use, rapid loss, and charging.
Free download
Printable 8.FGR.5.2 Worksheet
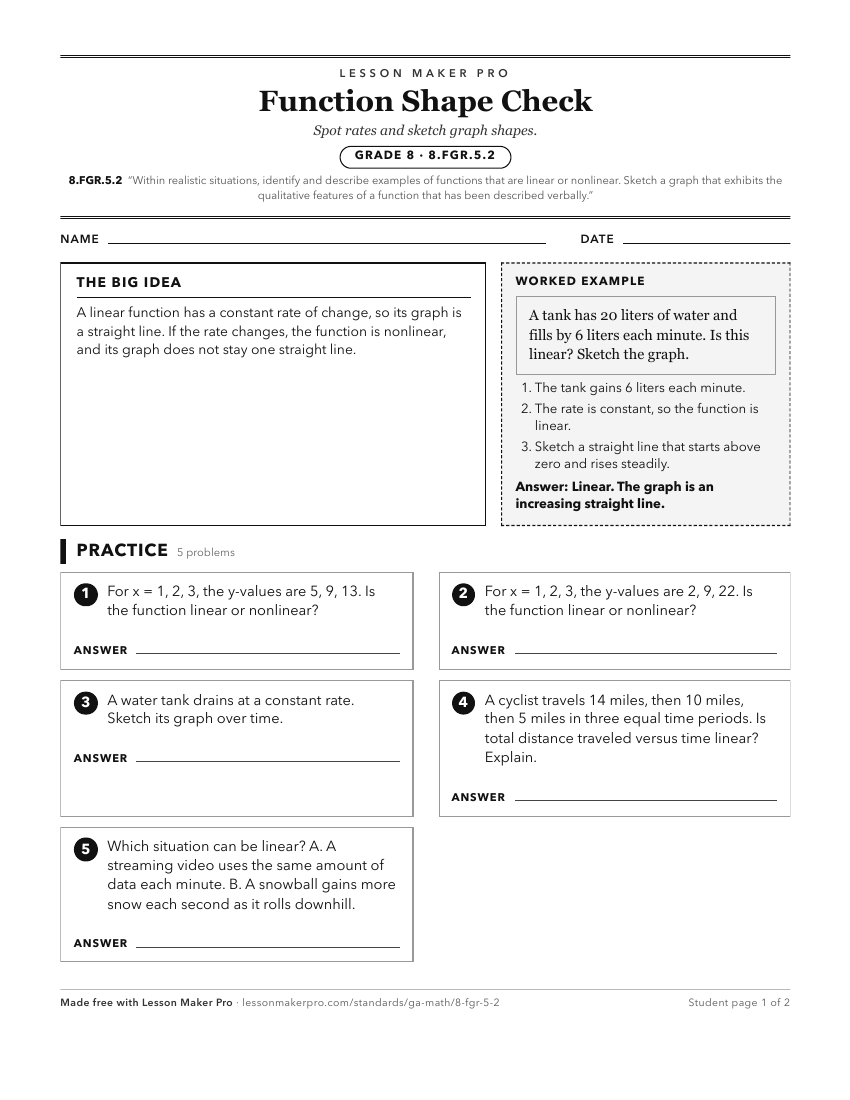
A ready-to-print activity worksheet aligned to 8.FGR.5.2, with an answer key for the teacher on its own page. No account needed.
PDF, US Letter, prints cleanly in black and white.
Download the worksheetKeep exploring
Related Standards
- 8.FGR.5
Describe the properties of functions to define, evaluate, and compare relationships, and use functions and graphs of functions to model and explain real phenome...
- 8.FGR.5.6
Write a linear function defined by an expression in different but equivalent forms to reveal and explain different properties of the function.
- 8.FGR.5.9
Graph and analyze linear functions expressed in various algebraic forms and show key characteristics of the graph to describe applicable situations.
- 8.FGR.5.3
Relate the domain of a linear function to its graph and where applicable to the quantitative relationship it describes.
Turn this exact standard into a lesson
Grade, subject, topic, and the complete standard are prefilled. Create one free, no account needed.
Also for this standard:Make a WorksheetMake a QuizMake a Sub Lesson