Georgia 8.FGR.5.4
The Standard
Compare properties (rate of change and initial value) of two functions used to model an authentic situation each represented in a different way (algebraically, graphically, numerically in tables, or by verbal descriptions).
Georgia's K-12 Mathematics Standards · Describe the properties of functions to define, evaluate, and compare relationships, and use functions and graphs of functions to model and explain real phenomena.
Teacher's field guide
What This Standard Means
What Students Need to Do
- Students identify the rate of change and starting value in two models shown in different forms. They compare those values and explain what the differences mean in the given situation.
What Mastery Looks Like
- Students correctly find the rate and starting value from equations, graphs, tables, and descriptions. They compare two models using units and explain what each value means in the situation. Their conclusions cite specific values from both representations.
Common Misconceptions
- Students may treat the first table entry as the initial value even when the input is not zero. They may compare graph steepness without checking axis scales. They also confuse the rate with the starting value or omit units.
How to Assess It
- Give students a bike rental equation, C = 6h + 12, and a table with costs of $10, $18, and $26 for 0, 1, and 2 hours. Ask which rental has the lower starting fee and which has the lower hourly rate, with evidence.
Lesson moves
Ways to Teach It
Sort card sets showing taxi fares as equations, tables, graphs, and descriptions, then pair models with the same starting fee and per-mile rate.
Compare two savings plans shown by a graph and a table, then write which begins higher and which grows faster.
Run rate-and-start relay rounds where teams identify both values from a representation card before comparing it with another card.
Collect pricing details from two local service plans, then model and compare each plan's starting charge and recurring rate.
Free download
Printable 8.FGR.5.4 Worksheet
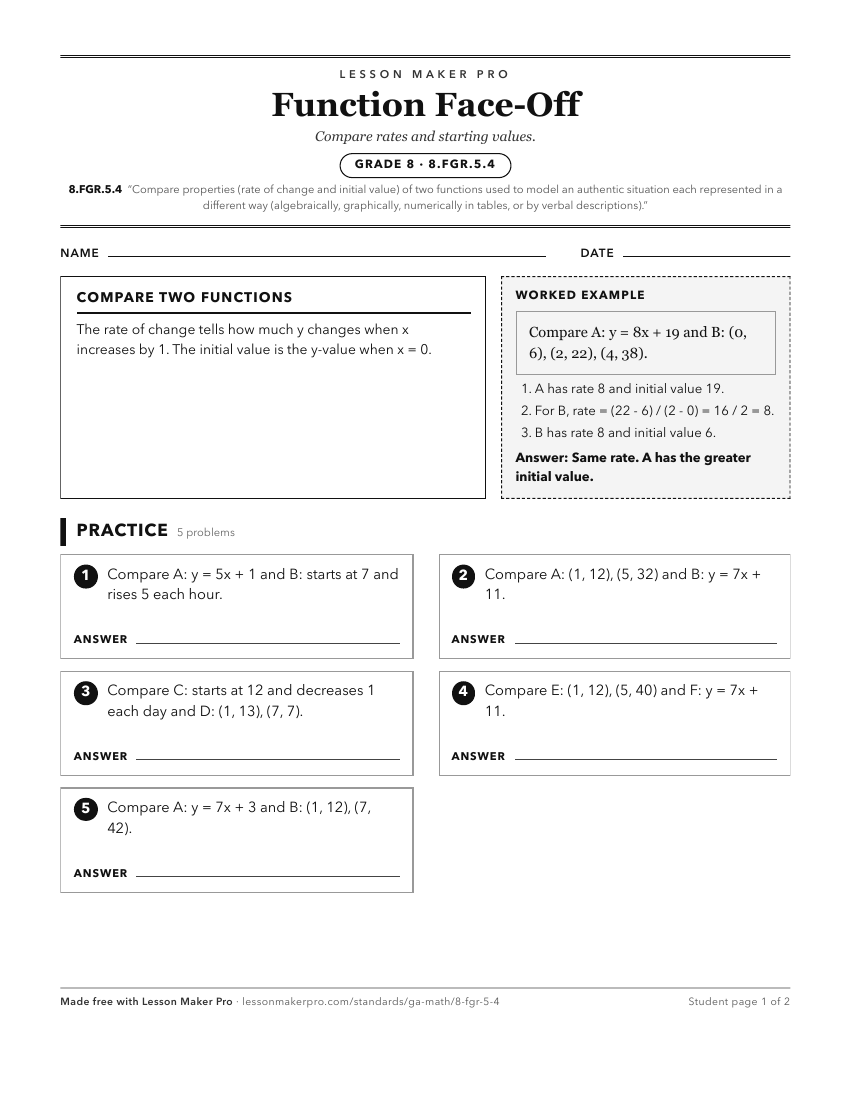
A ready-to-print activity worksheet aligned to 8.FGR.5.4, with an answer key for the teacher on its own page. No account needed.
PDF, US Letter, prints cleanly in black and white.
Download the worksheetKeep exploring
Related Standards
- 8.FGR.5
Describe the properties of functions to define, evaluate, and compare relationships, and use functions and graphs of functions to model and explain real phenome...
- 7.PAR.4.8
Graph proportional relationships, interpreting the unit rate as the slope of the graph. Compare two different proportional relationships represented in differen...
- 8.FGR.5.7
Construct a function to model a linear relationship between two quantities. Determine the rate of change and initial value of the function from a description of...
- 8.FGR.5.8
Explain the meaning of the rate of change and initial value of a linear function in terms of the situation it models, and in terms of its graph or a table of va...
Turn this exact standard into a lesson
Grade, subject, topic, and the complete standard are prefilled. Create one free, no account needed.
Also for this standard:Make a WorksheetMake a QuizMake a Sub Lesson