Georgia 7.PAR.4.8
The Standard
Graph proportional relationships, interpreting the unit rate as the slope of the graph. Compare two different proportional relationships represented in different ways.
Georgia's K-12 Mathematics Standards · Recognize proportional relationships in relevant, mathematical problems; represent, solve, and explain these relationships with tables, graphs, and equations.
Teacher's field guide
What This Standard Means
What Students Need to Do
- Students find the constant rate from a table, graph, equation, or context. They plot ordered pairs and connect them with a straight line through the origin. They use the rate to decide which of two situations grows faster, even when the representations differ.
What Mastery Looks Like
- A student can calculate the constant value of y divided by x and connect it to the steepness of a line. They can compare rates from different representations and support their choice with numbers.
Common Misconceptions
- Students may use the change in y without considering the change in x. They may assume every straight line shows a proportional relationship, even when it does not pass through the origin. Different axis scales can also make them compare visual steepness incorrectly.
How to Assess It
- Exit ticket: Graph the points (0,0), (2,6), and (4,12), label the unit rate, then compare the rate with y = 2.75x.
Lesson moves
Ways to Teach It
Use floor tape to make axes; students place coordinate cards for a $3-per-item situation, then stretch string through the points and origin.
Show a table with rate 4 and a graph with rate 3; ask, "Which grows faster, and what evidence proves it?"
Give groups context, table, graph, and equation cards to match, then have them rank the matched sets from least to greatest rate.
Compare two phone charging plans, one shown in a table and one by an equation, to decide which adds battery percentage faster.
Free download
Printable 7.PAR.4.8 Worksheet
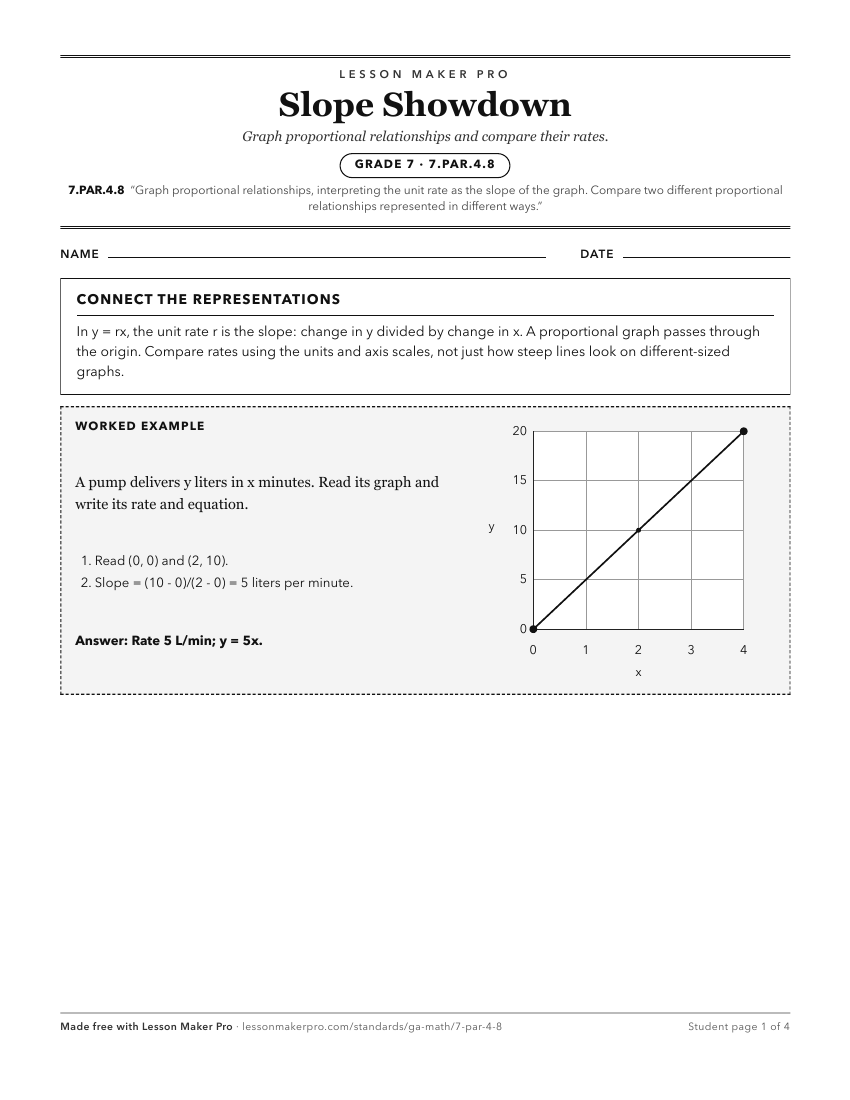
A ready-to-print activity worksheet aligned to 7.PAR.4.8, with an answer key for the teacher on its own page. No account needed.
PDF, US Letter, prints cleanly in black and white.
Download the worksheetKeep exploring
Related Standards
- 7.PAR.4.5
Use context to explain what a point (x, y) on the graph of a proportional relationship means in terms of the situation, with special attention to the points (0,...
- 7.PAR.4.2
Determine the unit rate (constant of proportionality) in tables, graphs (1, r), equations, diagrams, and verbal descriptions of proportional relationships to so...
- 8.PAR.4
Show and explain the connections between proportional and non-proportional relationships, lines, and linear equations; create and interpret graphical mathematic...
- 7.PAR.4.4
Identify, represent, and use proportional relationships.
Turn this exact standard into a lesson
Grade, subject, topic, and the complete standard are prefilled. Create one free, no account needed.
Also for this standard:Make a WorksheetMake a QuizMake a Sub Lesson