Georgia 8.FGR.5.8
The Standard
Explain the meaning of the rate of change and initial value of a linear function in terms of the situation it models, and in terms of its graph or a table of values.
Georgia's K-12 Mathematics Standards · Describe the properties of functions to define, evaluate, and compare relationships, and use functions and graphs of functions to model and explain real phenomena.
Teacher's field guide
What This Standard Means
What Students Need to Do
- Students identify the rate as the output change for each one-unit increase in the input. They identify the initial value as the output when the input is zero and explain both values in context.
What Mastery Looks Like
- Given a graph, table, or situation, students calculate the rate from two points and find or infer the output when the input is zero. They describe both values with correct units and connect them to slope and the vertical intercept.
Common Misconceptions
- Students may treat the first output in a table as the initial value, even when the input is not zero. They often confuse the rate with an output value or reverse the changes in output and input. They may omit units or miss that a negative rate means the output decreases.
How to Assess It
- Give this exit ticket: A bike rental costs $11 for 1 hour, $17 for 3 hours, and $23 for 5 hours. Find and explain the hourly rate and starting fee.
Lesson moves
Ways to Teach It
Use linking cubes to build towers that begin at 3 cubes and grow by 2, then record and graph step number and height.
Ask, “A taxi graph starts at $4 and rises $2.50 per mile. What does each number tell the rider?”
Have pairs match cards showing a situation, table, graph, and rate-and-initial-value statement, then justify each completed set.
Give students two ride-share pricing plans with base fees and per-mile charges, then have them choose the cheaper plan for three trips.
Free download
Printable 8.FGR.5.8 Worksheet
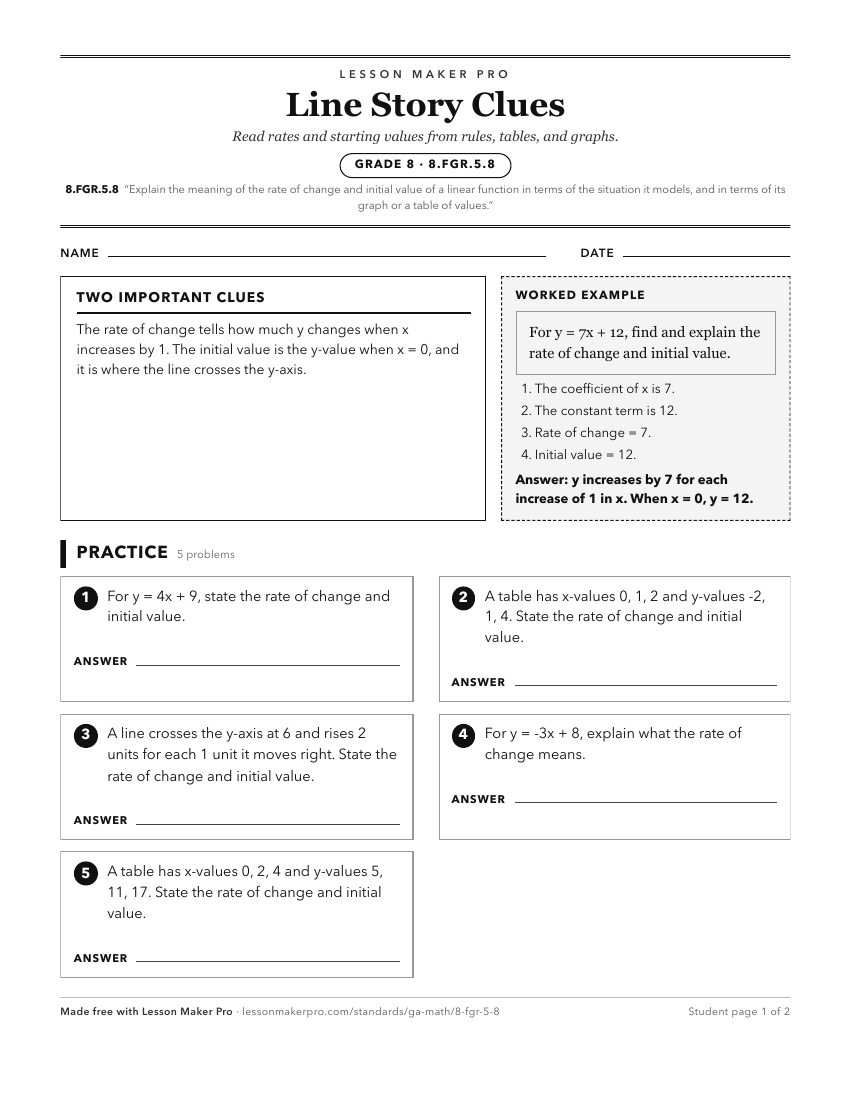
A ready-to-print activity worksheet aligned to 8.FGR.5.8, with an answer key for the teacher on its own page. No account needed.
PDF, US Letter, prints cleanly in black and white.
Download the worksheetKeep exploring
Related Standards
- 8.FGR.5.7
Construct a function to model a linear relationship between two quantities. Determine the rate of change and initial value of the function from a description of...
- 8.FGR.5.2
Within realistic situations, identify and describe examples of functions that are linear or nonlinear. Sketch a graph that exhibits the qualitative features of ...
- 8.FGR.5.4
Compare properties (rate of change and initial value) of two functions used to model an authentic situation each represented in a different way (algebraically, ...
- 8.FGR.6.3
Explain the meaning of the predicted slope (rate of change) and the predicted intercept (constant term) of a linear model in the context of the data.
Turn this exact standard into a lesson
Grade, subject, topic, and the complete standard are prefilled. Create one free, no account needed.
Also for this standard:Make a WorksheetMake a QuizMake a Sub Lesson