Georgia 7.PR.6.6
The Standard
Use appropriate graphical displays and numerical summaries from data distributions with categorical or quantitative (numerical) variables as probability models to draw informal inferences about two samples or populations.
Georgia's K-12 Mathematics Standards · Using mathematical reasoning, investigate chance processes and develop, evaluate, and use probability models to find probabilities of simple events presented in authentic situations.
Teacher's field guide
What This Standard Means
What Students Need to Do
- Students use sample data as a model for likely outcomes in two larger groups. They choose suitable graphs and summaries, compare the distributions, and make a supported informal inference.
What Mastery Looks Like
- Students select a useful graph, calculate relative frequencies or numerical summaries, and compare two samples. They make a reasonable claim about the populations and support it with specific evidence while recognizing sample uncertainty.
Common Misconceptions
- Students may compare sample counts without accounting for different sample sizes. They may treat a small sample as certain proof, or compare only the highest value while ignoring center, spread, and overlap.
How to Assess It
- Give students Route A times of 12, 13, 13, 14, 15 minutes and Route B times of 10, 12, 15, 17, 21 minutes. Ask them to graph both samples, estimate each route's probability of taking under 15 minutes, and state one supported inference.
Lesson moves
Ways to Teach It
Students draw 20 cubes with replacement from each of two hidden bags, graph color frequencies, and infer which bag favors blue.
Show two box plots of commute times and ask, “Which population is more likely to arrive within 20 minutes? Defend your claim.”
Teams match dot plots, five-number summaries, and inference cards, earning a point only when every match is justified.
Compare lunch survey samples from two grades, using relative-frequency bar graphs to predict which menu item each grade would choose.
Free download
Printable 7.PR.6.6 Worksheet
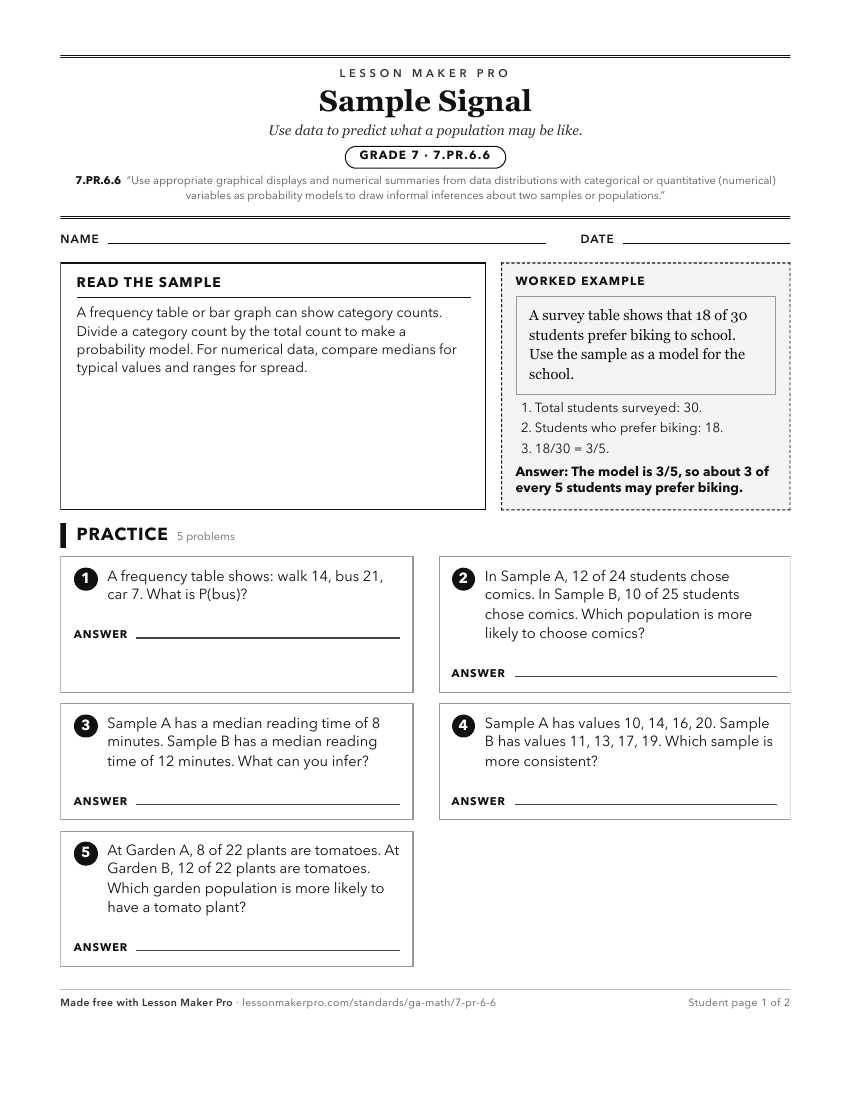
A ready-to-print activity worksheet aligned to 7.PR.6.6, with an answer key for the teacher on its own page. No account needed.
PDF, US Letter, prints cleanly in black and white.
Download the worksheetKeep exploring
Related Standards
- 6.NR.2.4
Design simple experiments and collect data. Use data gathered from realistic scenarios and simulations to determine quantitative measures of center (median and/...
- 8.FGR.6.4
Use appropriate graphical displays from data distributions involving lines of best fit to draw informal inferences and answer the statistical investigative ques...
- 6.NR.2.3
Interpret numerical data to answer a statistical investigative question created. Describe the distribution of a quantitative (numerical) variable collected, inc...
- 6.NR.2.2
Summarize categorical and quantitative (numerical) data sets in relation to the context: display the distributions of quantitative (numerical) data in plots on ...
Turn this exact standard into a lesson
Grade, subject, topic, and the complete standard are prefilled. Create one free, no account needed.
Also for this standard:Make a WorksheetMake a QuizMake a Sub Lesson