Georgia 6.NR.2.2
The Standard
Summarize categorical and quantitative (numerical) data sets in relation to the context: display the distributions of quantitative (numerical) data in plots on a number line, including dot plots, histograms, and box plots and display the distribution of categorical data using bar graphs.
Georgia's K-12 Mathematics Standards · Apply operations with whole numbers, fractions and decimals within relevant applications.
Teacher's field guide
What This Standard Means
What Students Need to Do
- Students organize categorical data in bar graphs and numerical data in dot plots, histograms, or box plots. They read each display and describe patterns, differences, and notable values in context.
What Mastery Looks Like
- Students select a suitable graph based on whether data are categorical or numerical. They create accurate displays with labels, scales, and frequencies, then describe patterns using the context.
Common Misconceptions
- Students may use bar graphs for numerical measurements or histograms for categories. They may leave gaps between histogram bars, confuse frequency with data values, or misread quartiles on box plots.
How to Assess It
- Give students a small set of numerical data and a categorical data table. Ask them to choose and draw one suitable display for each, then write one accurate comparison.
Lesson moves
Ways to Teach It
Have students measure classmates’ hand spans, then build a floor dot plot with sticky notes and convert it into a histogram.
Ask students which display best shows favorite lunch choices and which best shows lunch prices, then require evidence for each choice.
Play Graph Match by pairing data cards with bar graphs, dot plots, histograms, or box plots and explaining each match.
Use local weather temperatures and weather categories to create two displays, then write what each graph reveals about the month.
Free download
Printable 6.NR.2.2 Worksheet
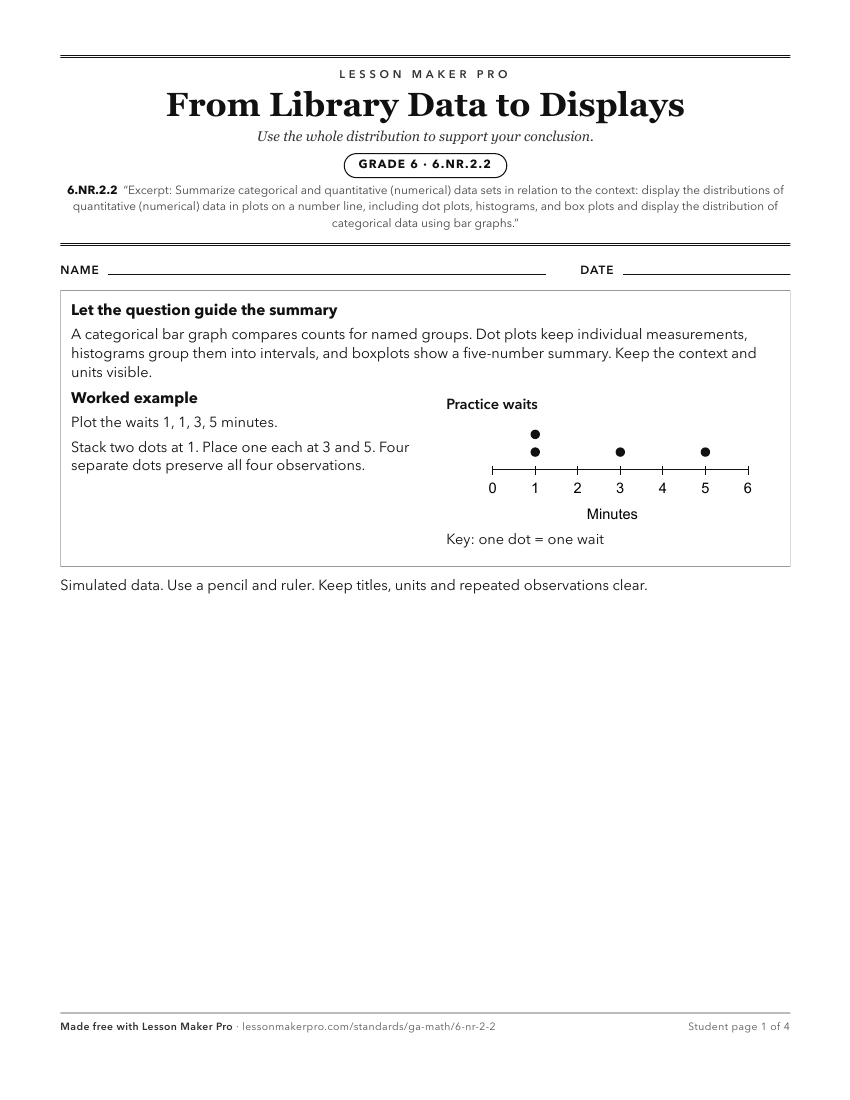
A ready-to-print activity worksheet aligned to 6.NR.2.2, with an answer key for the teacher on its own page. No account needed.
PDF, US Letter, prints cleanly in black and white.
Download the worksheetKeep exploring
Related Standards
- 6.NR.2.4
Design simple experiments and collect data. Use data gathered from realistic scenarios and simulations to determine quantitative measures of center (median and/...
- 6.NR.2.3
Interpret numerical data to answer a statistical investigative question created. Describe the distribution of a quantitative (numerical) variable collected, inc...
- 4.MDR.6.3
Create dot plots to display a distribution of numerical (quantitative) measurement data.
- 7.PR.6.6
Use appropriate graphical displays and numerical summaries from data distributions with categorical or quantitative (numerical) variables as probability models ...
Turn this exact standard into a lesson
Grade, subject, topic, and the complete standard are prefilled. Create one free, no account needed.
Also for this standard:Make a WorksheetMake a QuizMake a Sub Lesson