Georgia 4.MDR.6.3
The Standard
Create dot plots to display a distribution of numerical (quantitative) measurement data.
Georgia's K-12 Mathematics Standards · Measure time and objects that exist in the world to solve real-life, mathematical problems and analyze graphical displays of data to answer relevant questions.
Teacher's field guide
What This Standard Means
What Students Need to Do
- Students organize numerical measurements on a number line and place one dot for every data value. They choose equal intervals and add a clear title and measurement label.
What Mastery Looks Like
- A student creates an accurate number line with equal intervals, a title, and a measurement label. Each data value appears as one dot, with repeated values stacked neatly.
Common Misconceptions
- Students may place one dot for each different value instead of one dot for every measurement. They may use uneven intervals, omit values with no data, or spread repeated values across the scale instead of stacking them.
How to Assess It
- Exit ticket: Create a labeled dot plot for these pencil lengths in centimeters: 12, 13, 13, 14, 12, 15, 13.
Lesson moves
Ways to Teach It
Have each student measure a pencil to the nearest centimeter, then add a sticky dot above that value on a class number line.
Give students a measurement list and ask, "What scale would make this dot plot clear, and why?"
Pairs draw data cards, build dot plots on dry erase boards, then swap boards and check every value.
Survey classmates about daily reading minutes, then create a dot plot and identify the most common response.
Free download
Printable 4.MDR.6.3 Worksheet
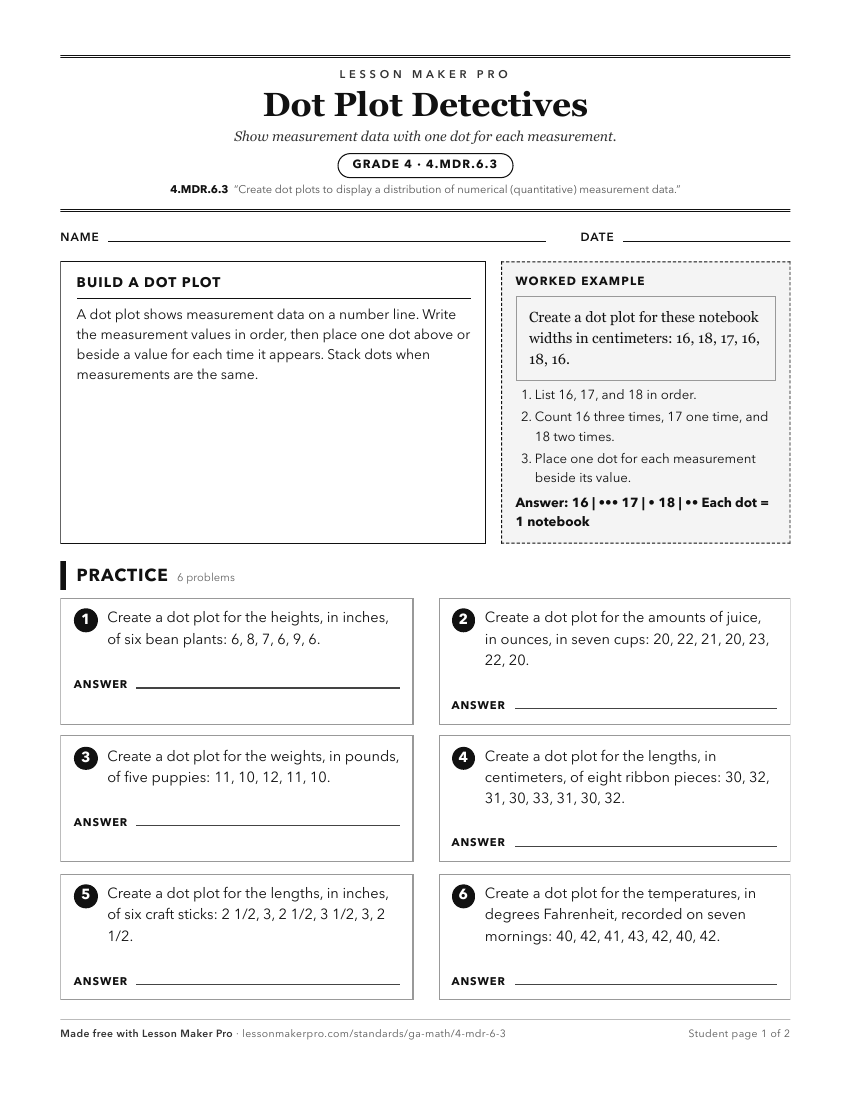
A ready-to-print activity worksheet aligned to 4.MDR.6.3, with an answer key for the teacher on its own page. No account needed.
PDF, US Letter, prints cleanly in black and white.
Download the worksheetKeep exploring
Related Standards
- 6.NR.2.3
Interpret numerical data to answer a statistical investigative question created. Describe the distribution of a quantitative (numerical) variable collected, inc...
- 6.NR.2.2
Summarize categorical and quantitative (numerical) data sets in relation to the context: display the distributions of quantitative (numerical) data in plots on ...
- 7.PR.6.6
Use appropriate graphical displays and numerical summaries from data distributions with categorical or quantitative (numerical) variables as probability models ...
- 6.NR.2.6
Describe the impact that inserting or deleting a data point has on the mean and the median of a data set. Create data displays using a dot plot or box plot to e...
Turn this exact standard into a lesson
Grade, subject, topic, and the complete standard are prefilled. Create one free, no account needed.
Also for this standard:Make a WorksheetMake a QuizMake a Sub Lesson