Georgia 6.NR.2.6
The Standard
Describe the impact that inserting or deleting a data point has on the mean and the median of a data set. Create data displays using a dot plot or box plot to examine this impact.
Georgia's K-12 Mathematics Standards · Apply operations with whole numbers, fractions and decimals within relevant applications.
Teacher's field guide
What This Standard Means
What Students Need to Do
- Students calculate the mean and median of a data set before and after one value is added or removed. They make dot plots or box plots to show and explain the changes.
What Mastery Looks Like
- Students correctly calculate both measures before and after a value is added or removed. They use a dot plot or box plot to explain why an outlier usually affects the mean more than the median.
Common Misconceptions
- Students may assume one added value changes the mean and median by the same amount. They may also misorder values, count plot marks incorrectly, or treat an outlier as the median.
How to Assess It
- Give students the data set 3, 4, 5, 6, 7, then add 20. Ask them to draw both dot plots and explain how the mean and median change.
Lesson moves
Ways to Teach It
Place number cards on a floor number line, add or remove one card, then recalculate and compare the mean and median.
Ask students to explain in writing which measure better represents a data set containing one extreme value and why.
Play Data Set Detective, where teams choose a value to add or remove to change the mean while keeping the median unchanged.
Use class shoe sizes, then add an adult shoe size and discuss how that new value changes the mean and median.
Free download
Printable 6.NR.2.6 Worksheet
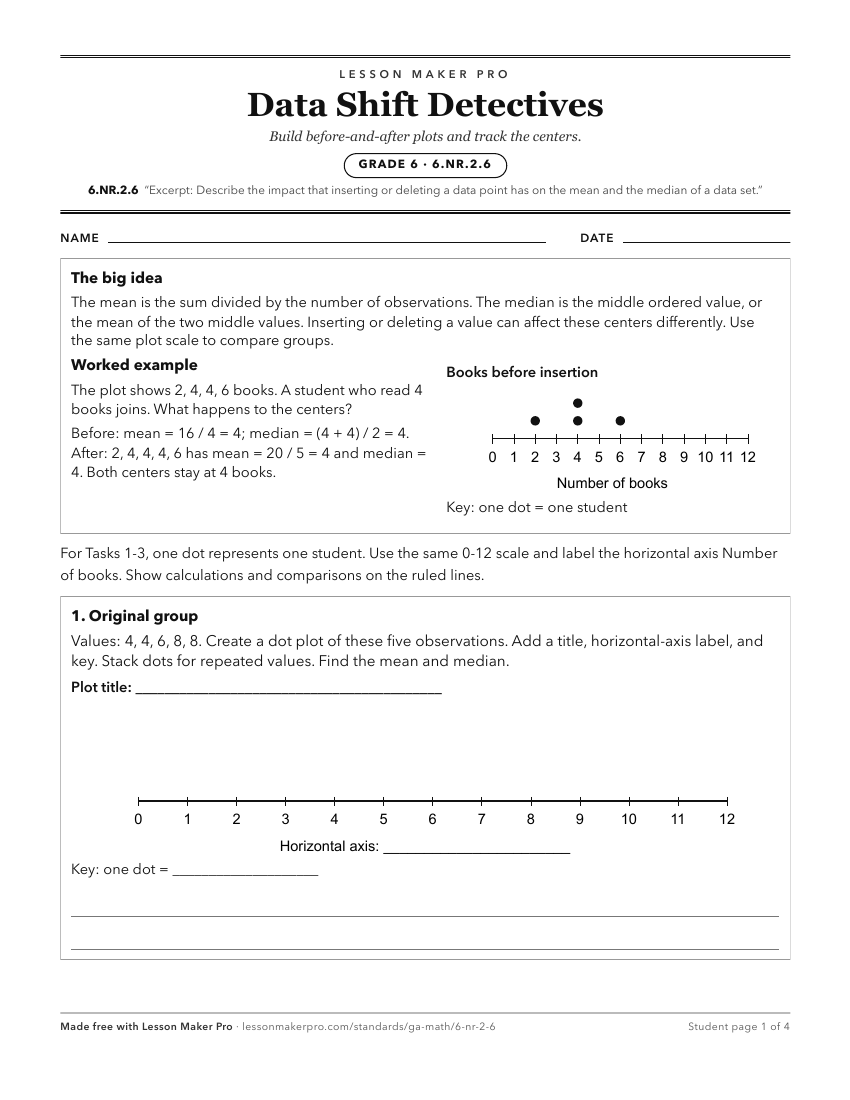
A ready-to-print activity worksheet aligned to 6.NR.2.6, with an answer key for the teacher on its own page. No account needed.
PDF, US Letter, prints cleanly in black and white.
Download the worksheetKeep exploring
Related Standards
- 6.NR.2.4
Design simple experiments and collect data. Use data gathered from realistic scenarios and simulations to determine quantitative measures of center (median and/...
- 6.NR.2.2
Summarize categorical and quantitative (numerical) data sets in relation to the context: display the distributions of quantitative (numerical) data in plots on ...
- 4.MDR.6.3
Create dot plots to display a distribution of numerical (quantitative) measurement data.
- 6.NR.2.5
Relate the choice of measures of center and variability to the shape of the data distribution and the context in which the data were gathered.
Turn this exact standard into a lesson
Grade, subject, topic, and the complete standard are prefilled. Create one free, no account needed.
Also for this standard:Make a WorksheetMake a QuizMake a Sub Lesson