Georgia 6.NR.2.5
The Standard
Relate the choice of measures of center and variability to the shape of the data distribution and the context in which the data were gathered.
Georgia's K-12 Mathematics Standards · Apply operations with whole numbers, fractions and decimals within relevant applications.
Teacher's field guide
What This Standard Means
What Students Need to Do
- Students read a dot plot, histogram, or data list and describe its shape, clusters, gaps, and outliers. They select a useful measure of center and spread, then explain how the data source and question support that choice.
What Mastery Looks Like
- A student recognizes that mean and mean absolute deviation fit roughly symmetric data without strong outliers. The student uses median and interquartile range for skewed data or outliers and explains the choice using the situation.
Common Misconceptions
- Students often choose the mean automatically, even when one extreme value pulls it away from most data. They may treat range and interquartile range as interchangeable, or confuse greater spread with a greater center. Some name a graph feature without connecting it to the context.
How to Assess It
- Exit ticket: For delivery times of 8, 9, 9, 10, 10, 11, 11, and 30 minutes, choose the best measure of center and variability. Explain how the shape and delivery context support both choices.
Lesson moves
Ways to Teach It
Build a floor dot plot with sticky notes, add one extreme value, then compare how the mean, median, range, and IQR change.
Discuss: A restaurant says its average wait is 12 minutes, but most customers wait 7 minutes; what data shape could explain this?
Play Match the Summary: pair dot plot cards with mean and MAD or median and IQR, then justify each match.
Compare staff salaries at a fictional company with one highly paid owner, then decide which center best represents a typical worker.
Free download
Printable 6.NR.2.5 Worksheet
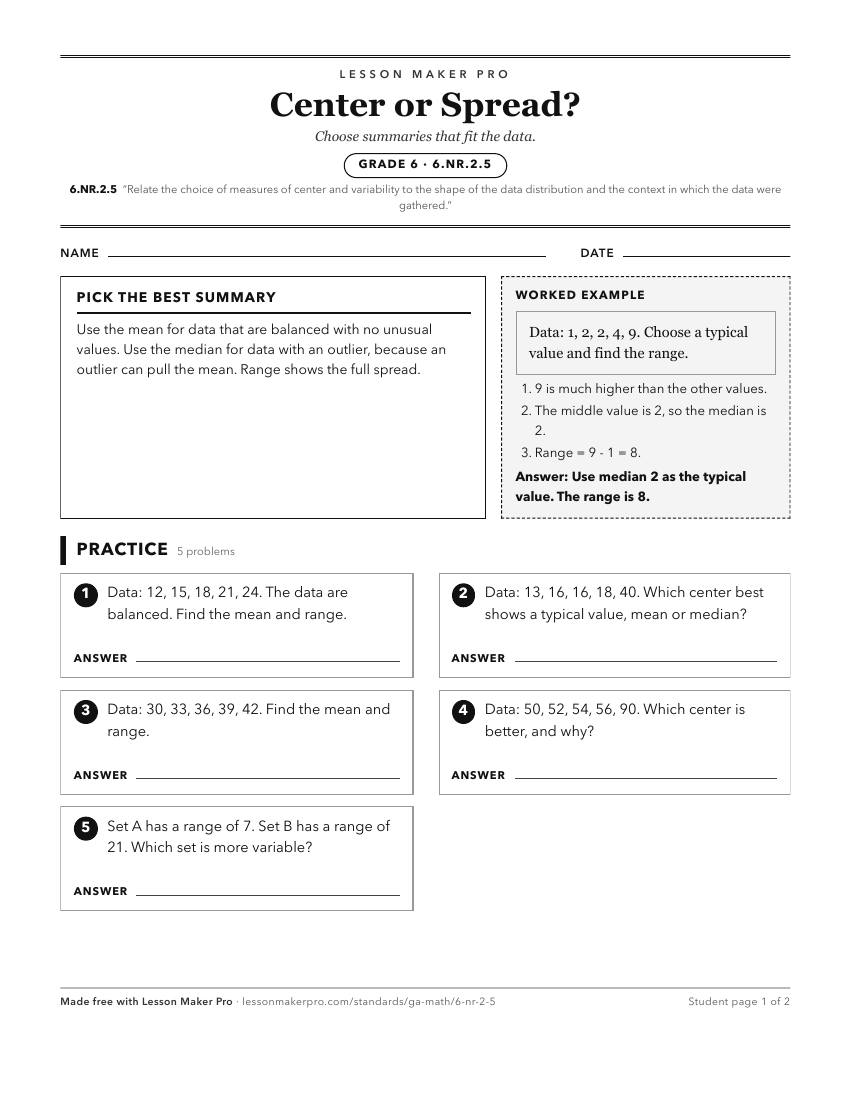
A ready-to-print activity worksheet aligned to 6.NR.2.5, with an answer key for the teacher on its own page. No account needed.
PDF, US Letter, prints cleanly in black and white.
Download the worksheetKeep exploring
Related Standards
- 6.NR.2.4
Design simple experiments and collect data. Use data gathered from realistic scenarios and simulations to determine quantitative measures of center (median and/...
- 6.NR.2.3
Interpret numerical data to answer a statistical investigative question created. Describe the distribution of a quantitative (numerical) variable collected, inc...
- 6.NR.2.1
Describe and interpret the center of the distribution by the equal share value (mean).
- 7.PR.6.6
Use appropriate graphical displays and numerical summaries from data distributions with categorical or quantitative (numerical) variables as probability models ...
Turn this exact standard into a lesson
Grade, subject, topic, and the complete standard are prefilled. Create one free, no account needed.
Also for this standard:Make a WorksheetMake a QuizMake a Sub Lesson