Georgia 6.NR.2.1
The Standard
Describe and interpret the center of the distribution by the equal share value (mean).
Georgia's K-12 Mathematics Standards · Apply operations with whole numbers, fractions and decimals within relevant applications.
Teacher's field guide
What This Standard Means
What Students Need to Do
- Students find the mean of a data set by combining all values and sharing the total equally among the values. They interpret the result as a fair-share or balance amount.
What Mastery Looks Like
- Students add all values, divide by the number of values, and label the result correctly. They can explain the mean as the amount each group would have after fair redistribution, even when it is not in the original data.
Common Misconceptions
- Students may divide by the total instead of the number of data values. They may think the mean must appear in the data set or must be a whole number. Some confuse the mean with the most common value.
How to Assess It
- Exit ticket: Four students read 2, 4, 5, and 9 books. Find the mean, then explain or draw how equal sharing shows your answer.
Lesson moves
Ways to Teach It
Give groups cups holding 3, 5, 7, and 9 counters, then have students redistribute the counters equally and identify the mean.
Ask students to explain whether the mean must be one of the original data values, using an example as evidence.
Play Mean Match by pairing data set cards with mean cards, then require partners to verify each match with calculations.
Use five days of classroom temperature readings to calculate the mean and describe what that average temperature tells the class.
Free download
Printable 6.NR.2.1 Worksheet
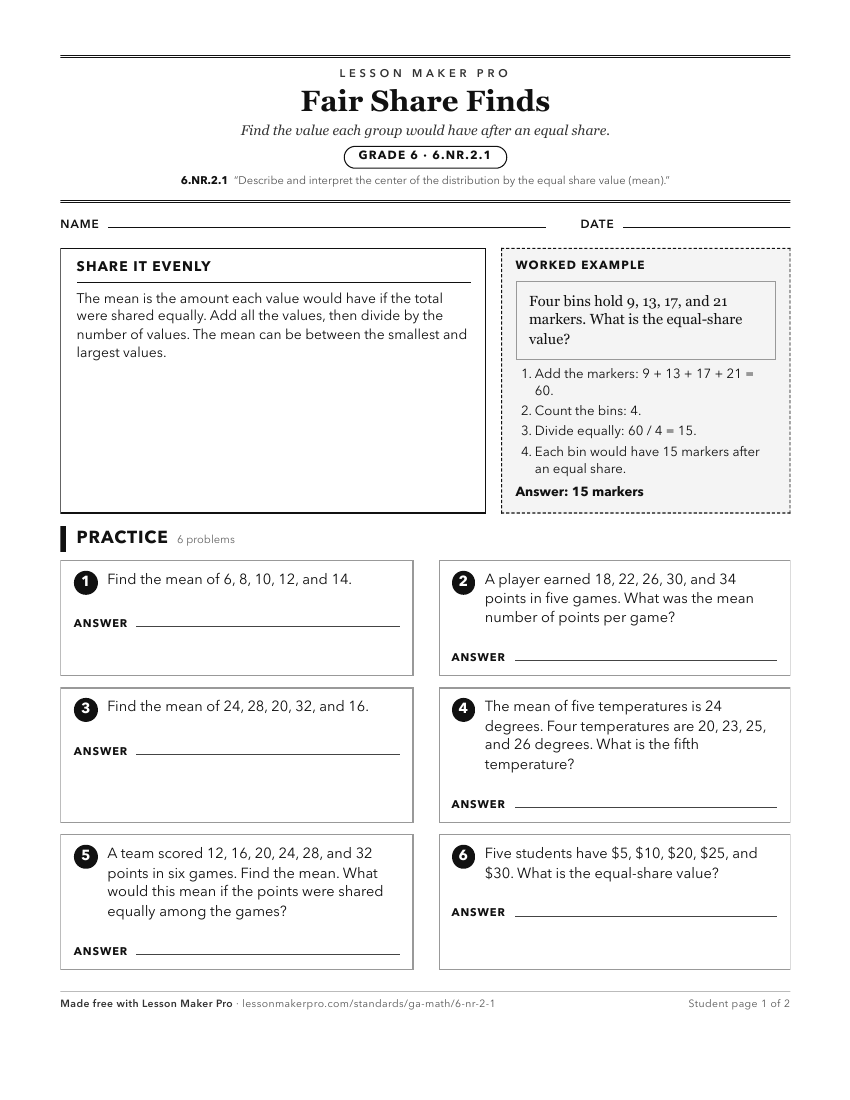
A ready-to-print activity worksheet aligned to 6.NR.2.1, with an answer key for the teacher on its own page. No account needed.
PDF, US Letter, prints cleanly in black and white.
Download the worksheetKeep exploring
Related Standards
- 6.NR.2.4
Design simple experiments and collect data. Use data gathered from realistic scenarios and simulations to determine quantitative measures of center (median and/...
- 6.NR.2.3
Interpret numerical data to answer a statistical investigative question created. Describe the distribution of a quantitative (numerical) variable collected, inc...
- 2.GSR.7.4
Recognize that equal shares of identical wholes may be different shapes within the same whole.
- 6.NR.2.5
Relate the choice of measures of center and variability to the shape of the data distribution and the context in which the data were gathered.
Turn this exact standard into a lesson
Grade, subject, topic, and the complete standard are prefilled. Create one free, no account needed.
Also for this standard:Make a WorksheetMake a QuizMake a Sub Lesson