Georgia 6.NR.2.4
The Standard
Design simple experiments and collect data. Use data gathered from realistic scenarios and simulations to determine quantitative measures of center (median and/or mean) and variability (interquartile range and range). Use these quantities to draw conclusions about the data, compare different numerical data sets, and make predictions.
Georgia's K-12 Mathematics Standards · Apply operations with whole numbers, fractions and decimals within relevant applications.
Teacher's field guide
What This Standard Means
What Students Need to Do
- Students design a simple experiment, record numerical results, and calculate mean, median, range, and interquartile range. They use those measures to compare data sets, explain patterns, and make reasonable predictions.
What Mastery Looks Like
- Given two data sets, students calculate each measure accurately and choose measures that support a comparison. They explain what the values mean in context and use the data to justify a prediction.
Common Misconceptions
- Students may find the median before ordering values or divide by the wrong count when finding the mean. They often confuse range with interquartile range or handle the median incorrectly when finding quartiles. Some assume a larger mean means more consistent data, ignoring variability.
How to Assess It
- Exit ticket: For A = 4, 5, 5, 6, 6, 7, 7, 8 and B = 1, 3, 5, 6, 6, 7, 9, 11, find the mean, median, range, and IQR. Which set is more consistent, and what measure supports your answer?
Lesson moves
Ways to Teach It
In groups, students drop a paper helicopter five times from the same height, record flight times, then calculate mean, median, range, and IQR.
Compare the data sets 4, 5, 5, 6, 6, 7 and 2, 4, 5, 6, 7, 9, then write which is more predictable and why.
Play Measure Match: students pair data cards with matching mean, median, range, and IQR cards, then check with a partner.
Use daily high temperatures from two recent weeks, calculate center and spread, then predict which week would feel more consistent.
Free download
Printable 6.NR.2.4 Worksheet
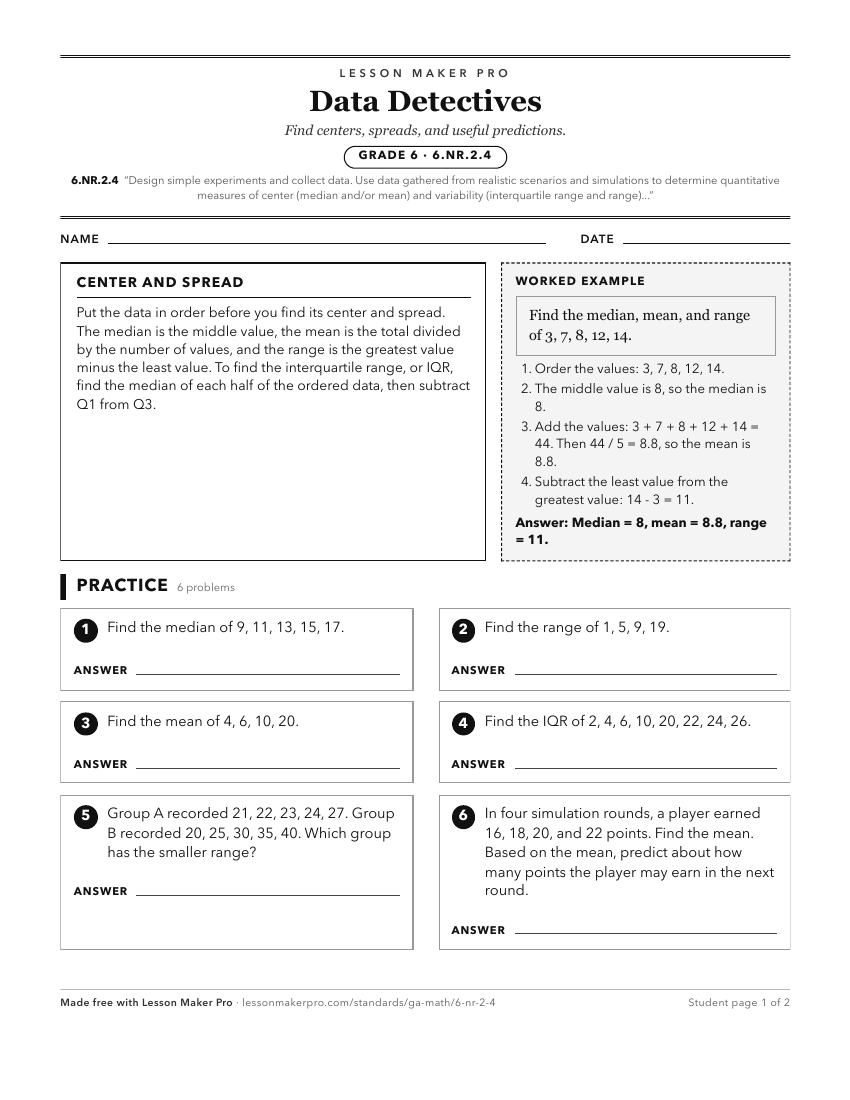
A ready-to-print activity worksheet aligned to 6.NR.2.4, with an answer key for the teacher on its own page. No account needed.
PDF, US Letter, prints cleanly in black and white.
Download the worksheetKeep exploring
Related Standards
- 6.NR.2.3
Interpret numerical data to answer a statistical investigative question created. Describe the distribution of a quantitative (numerical) variable collected, inc...
- 7.PR.6.6
Use appropriate graphical displays and numerical summaries from data distributions with categorical or quantitative (numerical) variables as probability models ...
- 6.NR.2.5
Relate the choice of measures of center and variability to the shape of the data distribution and the context in which the data were gathered.
- 8.FGR.6
Solve practical, linear problems involving situations using bivariate quantitative data.
Turn this exact standard into a lesson
Grade, subject, topic, and the complete standard are prefilled. Create one free, no account needed.
Also for this standard:Make a WorksheetMake a QuizMake a Sub Lesson