Georgia 8.FGR.6
Georgia Standard (Expectation Cluster)
Solve practical, linear problems involving situations using bivariate quantitative data.
Georgia's K-12 Mathematics Standards
Cluster contents
Expectations in This Standard
8.FGR.6 is a Georgia mathematics standard. These are the expectations under it.
- 8.FGR.6.1
Show that straight lines are widely used to model relationships between two quantitative variables. For scatter plots that suggest a linear association, visuall...
- 8.FGR.6.2
Use the equation of a linear model to solve problems in the context of bivariate measurement data, interpreting the slope and intercepts.
- 8.FGR.6.3
Explain the meaning of the predicted slope (rate of change) and the predicted intercept (constant term) of a linear model in the context of the data.
- 8.FGR.6.4
Use appropriate graphical displays from data distributions involving lines of best fit to draw informal inferences and answer the statistical investigative ques...
Teacher's field guide
What This Cluster Means
What Students Need to Do
- Students use paired numerical data to find and describe a linear relationship. They use a graph, trend line, or equation to answer practical questions and make predictions.
What Mastery Looks Like
- Students identify the input and output variables, describe the linear association, and use a trend line or equation to calculate a reasonable prediction. They interpret the slope and predicted value with correct units and judge whether the prediction fits the data range.
Common Misconceptions
- Students may expect every point to lie on the trend line or assume any association proves causation. They may switch the variables, ignore slope units, or make unreliable predictions far beyond the data range.
How to Assess It
- Give students a scatter plot with a trend line and its equation. Ask them to predict an output for one input and explain what the result means in context.
Lesson moves
Ways to Teach It
Measure classmates' arm spans and heights, plot the data, draw a trend line, and use it to predict an unmeasured height.
Ask students whether study time causes higher test scores, then write a claim supported by a provided scatter plot.
Play prediction relay with scatter plot cards, where teams estimate a value, use the model, and check whether the answer is reasonable.
Use local temperature and electricity-use data to build a linear model and predict electricity use for a given temperature.
Free download
Printable 8.FGR.6 Worksheet
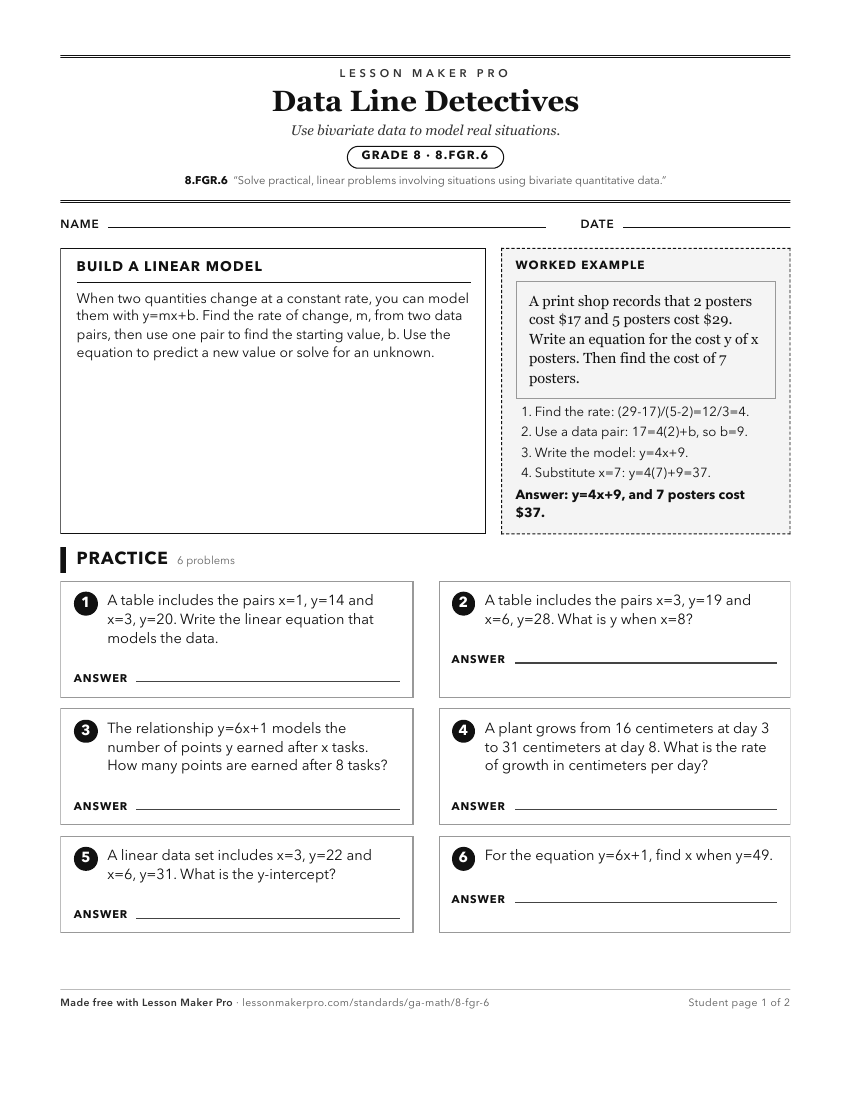
A ready-to-print activity worksheet aligned to 8.FGR.6, with an answer key for the teacher on its own page. No account needed.
PDF, US Letter, prints cleanly in black and white.
Download the worksheetKeep exploring
Related Standards
- 3.MDR.5
Solve real-life, mathematical problems involving length, liquid volume, mass, and time and analyze graphical displays of data to answer relevant questions.
- 8.FGR.7
Justify and use various strategies to solve systems of linear equations to model and explain realistic phenomena.
- 8.FGR.7.1
Interpret and solve relevant mathematical problems leading to two linear equations in two variables.
Turn this cluster into a lesson
Grade, subject, topic, and the complete cluster are prefilled. Create one free, no account needed.
Also for this cluster:Make a WorksheetMake a QuizMake a Sub Lesson