Georgia 7.PAR.4.10
The Standard
Predict characteristics of a population by examining the characteristics of a representative sample. Recognize the potential limitations and scope of the sample to the population.
Georgia's K-12 Mathematics Standards · Recognize proportional relationships in relevant, mathematical problems; represent, solve, and explain these relationships with tables, graphs, and equations.
Teacher's field guide
What This Standard Means
What Students Need to Do
- Students use results from a representative sample to estimate counts or proportions in a larger population. They explain when an estimate is reasonable and which population the claim can cover.
What Mastery Looks Like
- A student calculates a sample proportion and uses it to estimate a count or proportion for the larger population. The student checks how the sample was selected and limits claims to an appropriate group.
Common Misconceptions
- Students may treat a sample estimate as an exact population value. They may assume any large sample is representative, overlook selection bias, or apply findings beyond the group sampled.
How to Assess It
- Exit ticket: A random sample of 50 of 400 seventh graders finds 18 prefer a later start. Estimate the total, then name one limit.
Lesson moves
Ways to Teach It
Fill a bag with two colors of cubes, draw random samples, predict the full bag’s makeup, then compare with the actual counts.
Compare three student survey methods and write which sample is most representative, citing who was included and who was missed.
Play Sample Detective with scenario cards, sorting each sample as representative or biased and defending each choice.
Analyze a published opinion poll, use its sample results to predict population views, and list groups the claim may not represent.
Free download
Printable 7.PAR.4.10 Worksheet
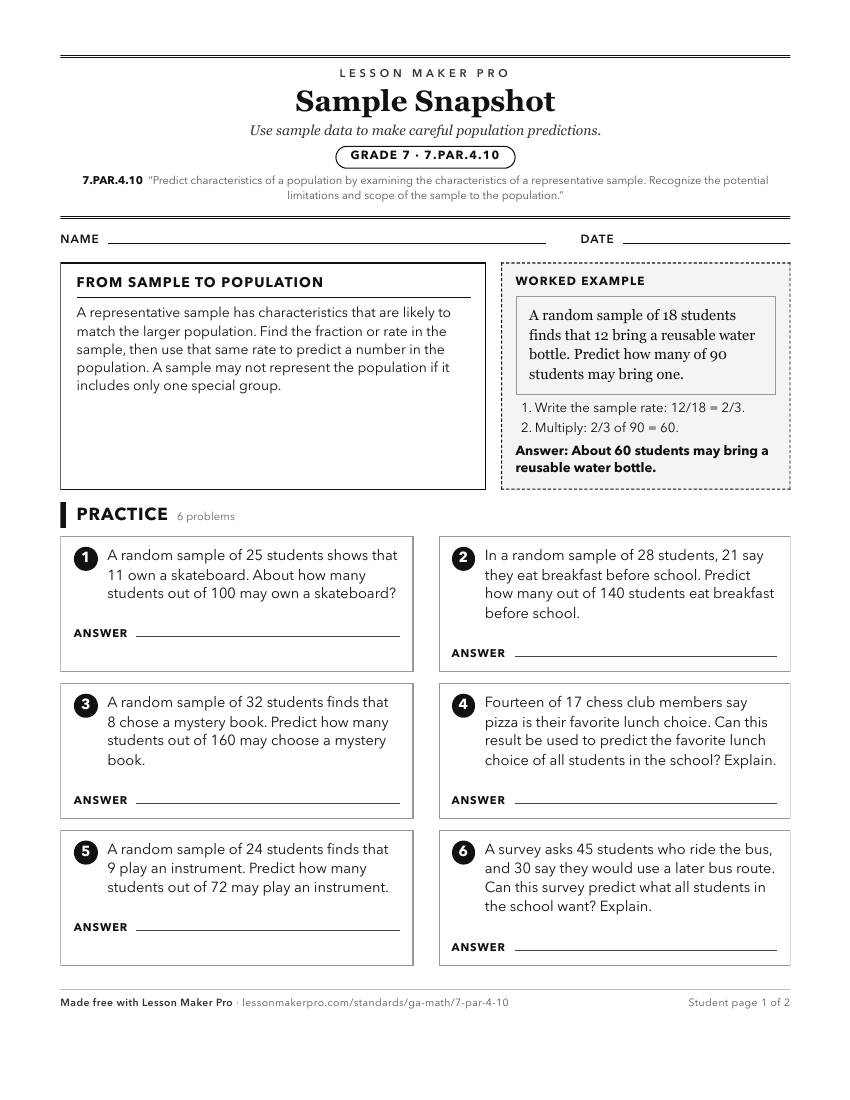
A ready-to-print activity worksheet aligned to 7.PAR.4.10, with an answer key for the teacher on its own page. No account needed.
PDF, US Letter, prints cleanly in black and white.
Download the worksheetKeep exploring
Related Standards
- 6.NR.2.4
Design simple experiments and collect data. Use data gathered from realistic scenarios and simulations to determine quantitative measures of center (median and/...
- 7.PAR.4.12
Use data from repeated random samples to evaluate how much a sample mean is expected to vary from a population mean. Simulate multiple samples of the same size.
- 7.PR.6.6
Use appropriate graphical displays and numerical summaries from data distributions with categorical or quantitative (numerical) variables as probability models ...
- 7.PAR.4.11
Analyze sampling methods and conclude that random sampling produces and supports valid inferences.
Turn this exact standard into a lesson
Grade, subject, topic, and the complete standard are prefilled. Create one free, no account needed.
Also for this standard:Make a WorksheetMake a QuizMake a Sub Lesson