Georgia 7.PAR.4.12
The Standard
Use data from repeated random samples to evaluate how much a sample mean is expected to vary from a population mean. Simulate multiple samples of the same size.
Georgia's K-12 Mathematics Standards · Recognize proportional relationships in relevant, mathematical problems; represent, solve, and explain these relationships with tables, graphs, and equations.
Teacher's field guide
What This Standard Means
What Students Need to Do
- Students take many random samples of the same size from a known population and calculate each sample mean. They compare those means with the population mean to describe how much sampling results usually vary.
What Mastery Looks Like
- Students can simulate repeated random samples of equal size and calculate each sample mean correctly. They can organize the means in a table or dot plot, compare them with the population mean, and describe their variation.
Common Misconceptions
- Students may expect every sample mean to equal the population mean. They may confuse variation among individual data values with variation among sample means. They may also compare samples of different sizes or choose samples nonrandomly.
How to Assess It
- Give students a population mean of 20 and sample means of 18, 21, 19, 22, and 20. Ask them to describe how far sample means typically vary from 20 and support their answer with the data.
Lesson moves
Ways to Teach It
Place numbered tiles in a bag, draw repeated samples of five, replace the tiles each time, and graph the resulting sample means.
Ask students to explain why two random samples from the same population can have different means without either sample being incorrect.
Teams draw samples from identical data sets and earn points for correctly calculating and placing each sample mean on a class dot plot.
Use repeated samples of product weights to decide whether a factory's average package weight appears consistent with its stated target.
Free download
Printable 7.PAR.4.12 Worksheet
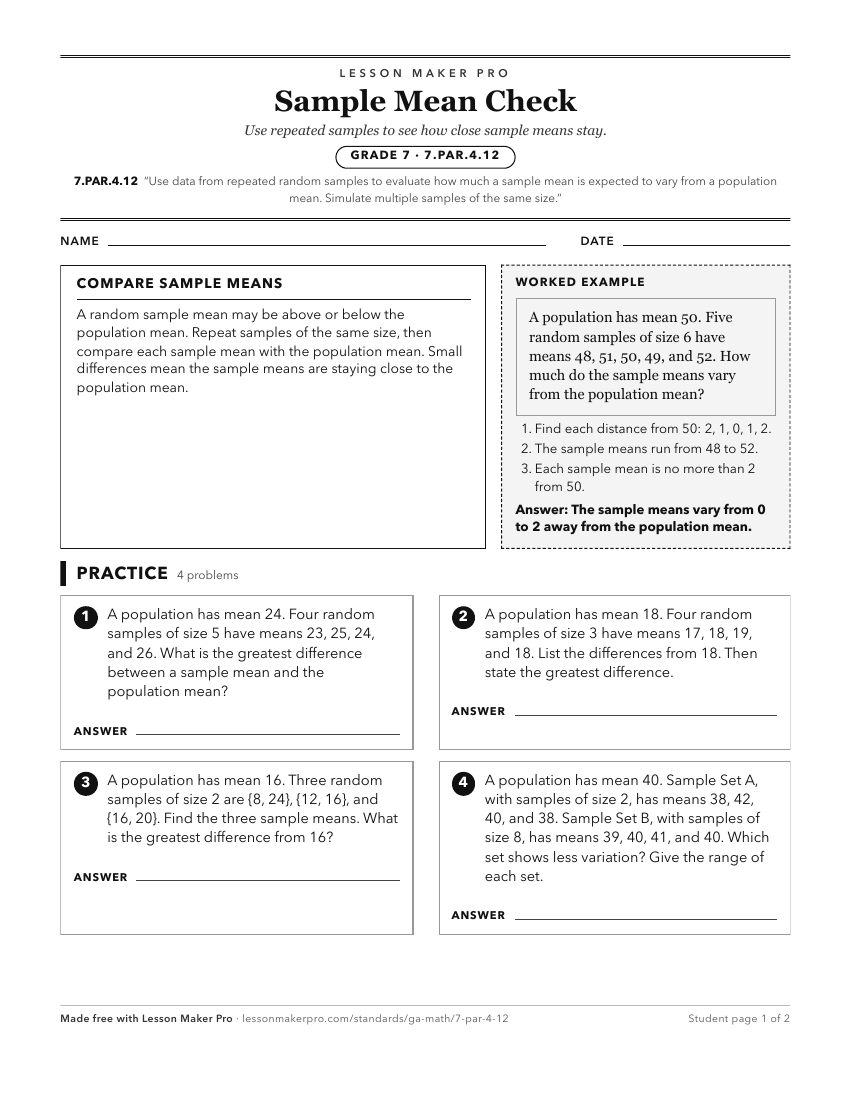
A ready-to-print activity worksheet aligned to 7.PAR.4.12, with an answer key for the teacher on its own page. No account needed.
PDF, US Letter, prints cleanly in black and white.
Download the worksheetKeep exploring
Related Standards
- 6.NR.2.4
Design simple experiments and collect data. Use data gathered from realistic scenarios and simulations to determine quantitative measures of center (median and/...
- 7.PAR.4.10
Predict characteristics of a population by examining the characteristics of a representative sample. Recognize the potential limitations and scope of the sample...
- 7.PR.6.6
Use appropriate graphical displays and numerical summaries from data distributions with categorical or quantitative (numerical) variables as probability models ...
- 7.PR.6.2
Approximate the probability of a chance event by collecting data on an event and observing its long-run relative frequency will approach the theoretical probabi...
Turn this exact standard into a lesson
Grade, subject, topic, and the complete standard are prefilled. Create one free, no account needed.
Also for this standard:Make a WorksheetMake a QuizMake a Sub Lesson