Virginia SOL PS.1.c
SOL Standard (Key Ideas Cluster)
- PS.1
- The student will demonstrate an understanding of scientific and engineering practices by
interpreting, analyzing, and evaluating data construct and interpret data tables showing independent and dependent variables, repeated trials, and means construct, analyze, and interpret graphical displays of data and consider limitations of data analysis apply mathematical concepts and processes to scientific questions use data to evaluate and refine design solutions to best meet criteria
Virginia Standards of Learning for Science · The student will demonstrate an understanding of scientific and engineering practices by
Cluster contents
Key Ideas in This Standard
PS.1.c is a Standards of Learning science standard. These are the key ideas and practices under it.
- PS.1.c.i
construct and interpret data tables showing independent and dependent variables, repeated trials, and means
- PS.1.c.ii
construct, analyze, and interpret graphical displays of data and consider limitations of data analysis
- PS.1.c.iii
apply mathematical concepts and processes to scientific questions
- PS.1.c.iv
use data to evaluate and refine design solutions to best meet criteria
Teacher's field guide
What This Cluster Means
What Students Need to Do
- Students organize results from repeated trials, identify what was changed and measured, and calculate means. They choose useful graphs, find patterns, and explain limits in the evidence. They use those patterns to choose or improve a design against stated criteria.
What Mastery Looks Like
- Given a data set, a student labels the independent and dependent variables, calculates accurate means, and builds a graph with sensible scales and units. The student describes the pattern, names a limitation, and uses evidence to recommend a design change.
Common Misconceptions
- Students often swap independent and dependent variables, average incorrectly, or treat repeated trials as separate conditions. They may use uneven graph scales, omit units, or claim that a trend proves more than the data show. They may also choose the highest result without checking every design criterion.
How to Assess It
- Bridges A, B, and C held 8, 10, 9 N; 12, 11, 13 N; and 10, 10, 11 N, and cost $2, $5, and $3. Students calculate means, graph them, name one limitation, and choose a bridge that holds at least 10 N for no more than $3.
Lesson moves
Ways to Teach It
Test three paper helicopter blade lengths for three drops each, then record flight times, calculate means, and graph blade length against mean time.
Write a claim about which cup material keeps water warmest, then cite two data points and identify one limit of the test.
Play Graph Match with cards showing data tables, variable labels, graph types, and conclusions, and have teams justify each matched set.
Compare test data for phone case prototypes, then recommend the design that best balances drop protection, cost, and weight.
Free download
Printable PS.1.c Worksheet
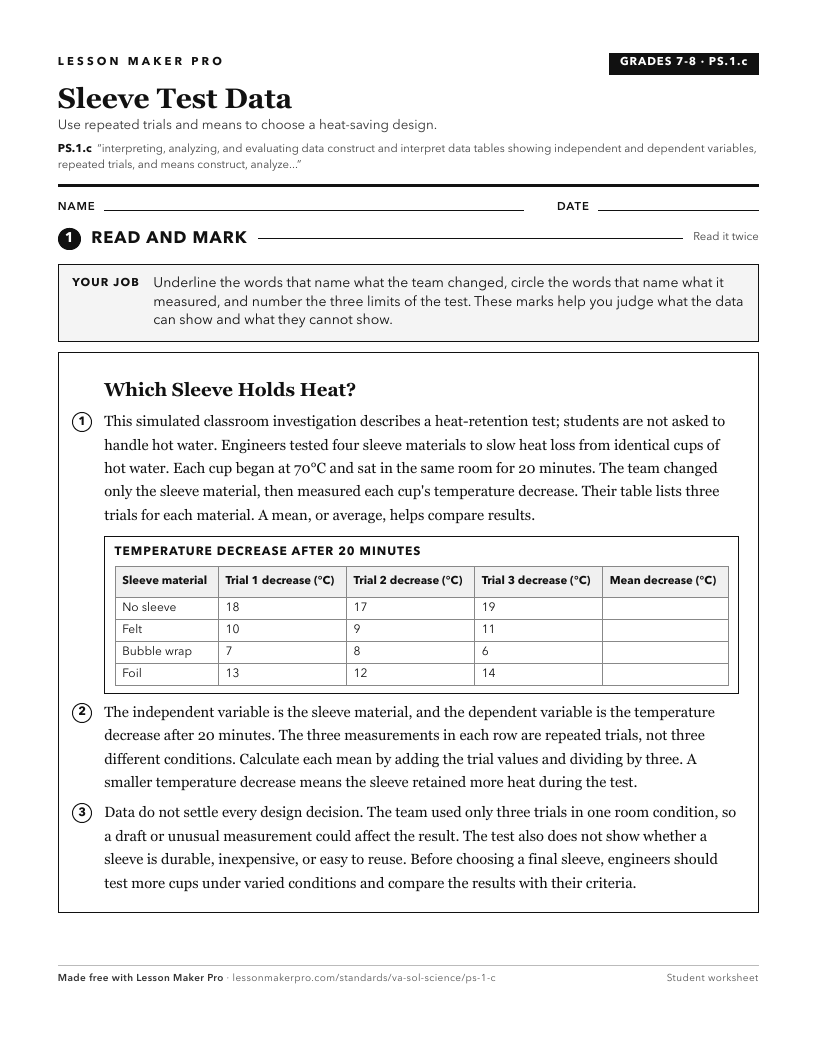
A ready-to-print activity worksheet aligned to PS.1.c, with an answer key for the teacher on its own page. No account needed.
PDF, US Letter, prints cleanly in black and white.
Download the worksheetKeep exploring
Related Standards
Turn this cluster into a lesson
Grade, subject, topic, and the complete cluster are prefilled. Create one free, no account needed.
Also for this cluster:Make a WorksheetMake a QuizMake a Sub Lesson