Virginia SOL PS.1.c.i
The Standard
- PS.1
- The student will demonstrate an understanding of scientific and engineering practices by
interpreting, analyzing, and evaluating data construct and interpret data tables showing independent and dependent variables, repeated trials, and means
Virginia Standards of Learning for Science · The student will demonstrate an understanding of scientific and engineering practices by
Teacher's field guide
What This Standard Means
What Students Need to Do
- Students organize investigation results in a clear table with labeled variables, units, and results from each trial. They calculate a mean for each tested condition and use the table to identify patterns.
What Mastery Looks Like
- A student correctly places the changed variable and measured outcome in the table and includes units. The student calculates each mean accurately and supports a conclusion with specific values.
Common Misconceptions
- Students may reverse the changed and measured variables or average results from different conditions together. They may divide by the wrong number of trials, omit units, or treat one unusual result as the overall pattern.
How to Assess It
- Give students three trial results for two temperatures. Ask them to label both variables, build a table, calculate each mean, and write one comparison.
Lesson moves
Ways to Teach It
Measure toy car travel time at three ramp heights, run three trials per height, then build a table and calculate mean times.
Given a data table, write a claim about how ramp height affected travel time and cite two mean values.
Sort cards labeled variable, unit, trial result, or mean into the correct table headings, then compare with an answer key.
Test three paper towel brands with equal water volumes, calculate mean absorption across trials, and recommend one brand from the data.
Free download
Printable PS.1.c.i Worksheet
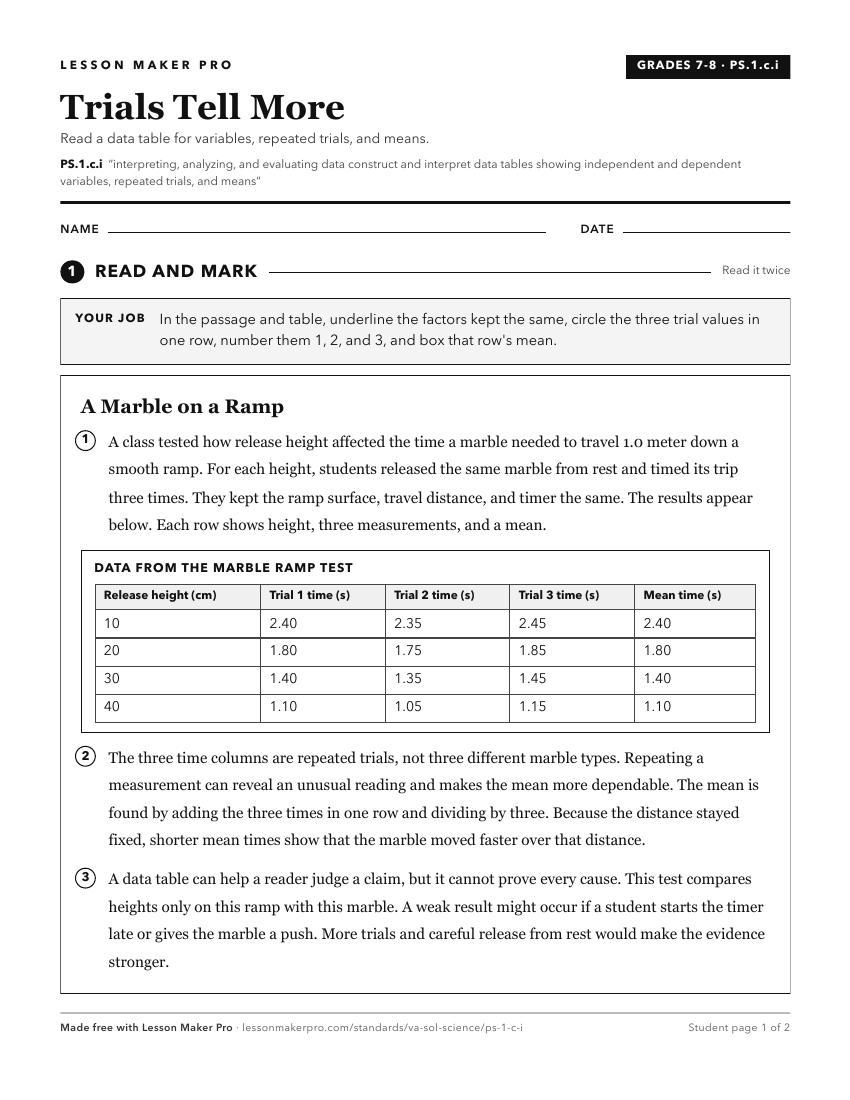
A ready-to-print activity worksheet aligned to PS.1.c.i, with an answer key for the teacher on its own page. No account needed.
PDF, US Letter, prints cleanly in black and white.
Download the worksheetKeep exploring
Related Standards
- 6.1.c.ii
construct, analyze, and interpret graphical displays of data
- 6.1.a.ii
develop hypotheses and identify independent and dependent variables
- LS.1.a.i
ask questions and develop hypotheses to determine relationships between independent and dependent variables
- 5.1.c.i
represent and analyze data using tables and graphs
Turn this exact standard into a lesson
Grade, subject, topic, and the complete standard are prefilled. Create one free, no account needed.
Also for this standard:Make a WorksheetMake a QuizMake a Sub Lesson