Virginia SOL 5.1.c.i
The Standard
- 5.1
- The student will demonstrate an understanding of scientific and engineering practices by
interpreting, analyzing, and evaluating data represent and analyze data using tables and graphs
Virginia Standards of Learning for Science · The student will demonstrate an understanding of scientific and engineering practices by
Teacher's field guide
What This Standard Means
What Students Need to Do
- Students organize observations or measurements in a clear table, then make a graph with a title, labels, units, and a sensible scale. They use the display to identify patterns, compare values, and support a conclusion.
What Mastery Looks Like
- A student can choose a useful graph, plot data accurately, and explain what the graph shows. The student can also spot missing labels, uneven scales, or claims that the data do not support.
Common Misconceptions
- Students may treat the table and graph as separate data sets or plot categories at equal values by mistake. They may skip units, use inconsistent scales, or make conclusions based on one point instead of the overall pattern.
How to Assess It
- Give students a six-row table of plant heights measured over time. Ask them to graph the data and write one pattern and one conclusion supported by two values.
Lesson moves
Ways to Teach It
Have pairs measure how high three balls bounce, record three trials in a table, and create a graph of the averages.
Show a graph with one missing label and ask students to write what is unclear and how they would fix it.
Run a card match game where students pair data tables with the correct graphs and explain each match.
Use one week of local temperatures to make a line graph and decide which day had the greatest temperature change.
Free download
Printable 5.1.c.i Worksheet
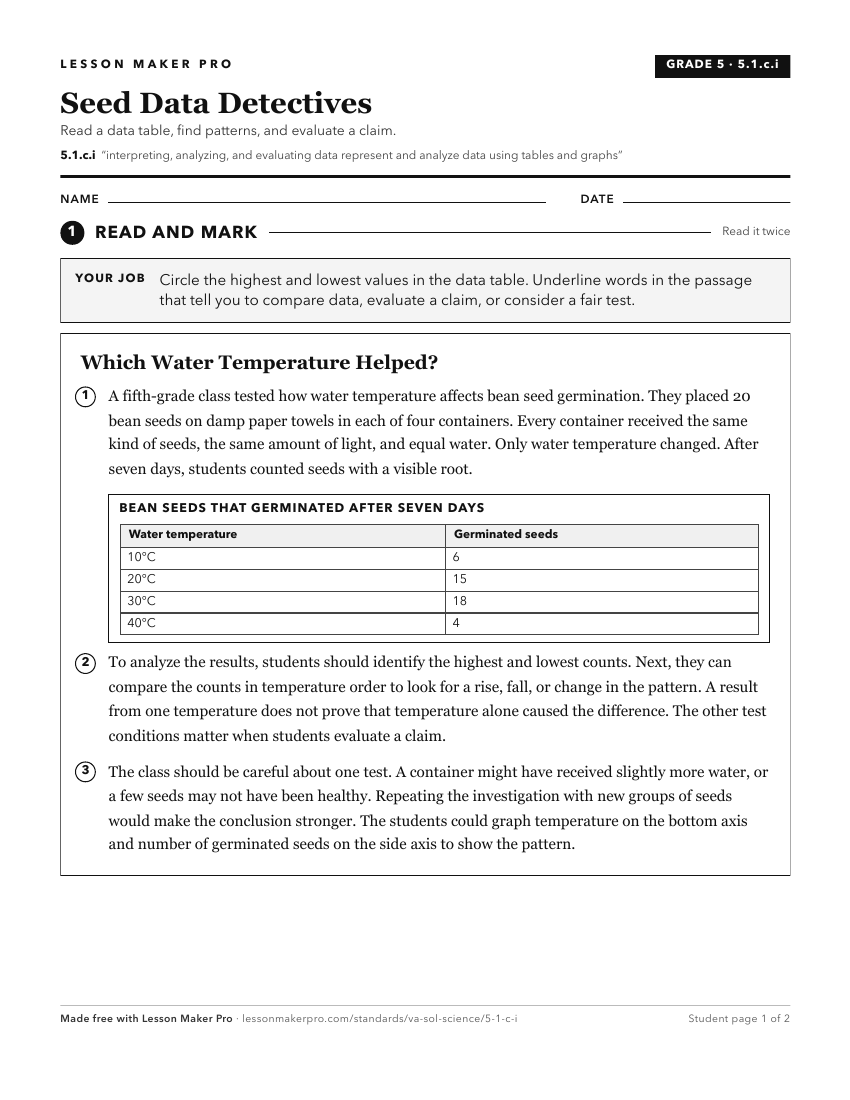
A ready-to-print activity worksheet aligned to 5.1.c.i, with an answer key for the teacher on its own page. No account needed.
PDF, US Letter, prints cleanly in black and white.
Download the worksheetKeep exploring
Related Standards
- K.1.c.iv
read and interpret data in object graphs, picture graphs, and tables
- 1.1.c.iv
organize and represent various forms of data using tables, picture graphs, and object graphs
- 4.1.c.i
organize and represent data in bar graphs and line graphs
- 4.1.c.ii
interpret and analyze data represented in bar graphs and line graphs
Turn this exact standard into a lesson
Grade, subject, topic, and the complete standard are prefilled. Create one free, no account needed.
Also for this standard:Make a WorksheetMake a QuizMake a Sub Lesson