Virginia SOL K.1.c.iv
The Standard
- K.1
- The student will demonstrate an understanding of scientific and engineering practices by
interpreting, analyzing, and evaluating data read and interpret data in object graphs, picture graphs, and tables
Virginia Standards of Learning for Science · The student will demonstrate an understanding of scientific and engineering practices by
Teacher's field guide
What This Standard Means
What Students Need to Do
- Students use simple graphs and tables to compare groups and answer questions. They identify which group has more, fewer, or the same number and count to support an answer.
What Mastery Looks Like
- A student counts each group accurately and explains what the display shows. The student answers questions using evidence, such as, “Four children chose apples, so apples got the most votes.”
Common Misconceptions
- Students may count the pictures but ignore what each row or column represents. They may confuse most with least, skip objects, or recount the same object twice.
How to Assess It
- Show a picture graph with votes for apples, bananas, and grapes. Ask, “Which fruit has the fewest votes, and how do you know?”
Lesson moves
Ways to Teach It
Have students sort classroom buttons by color, place them in rows, and compare the number in each row.
Show a class snack graph and ask, “What do you notice, and what can you prove by counting?”
Play Graph Detective by giving pairs a picture graph and question cards about most, fewest, and equal groups.
Record the day’s weather for one week in a table, then ask which type of weather occurred most often.
Free download
Printable K.1.c.iv Worksheet
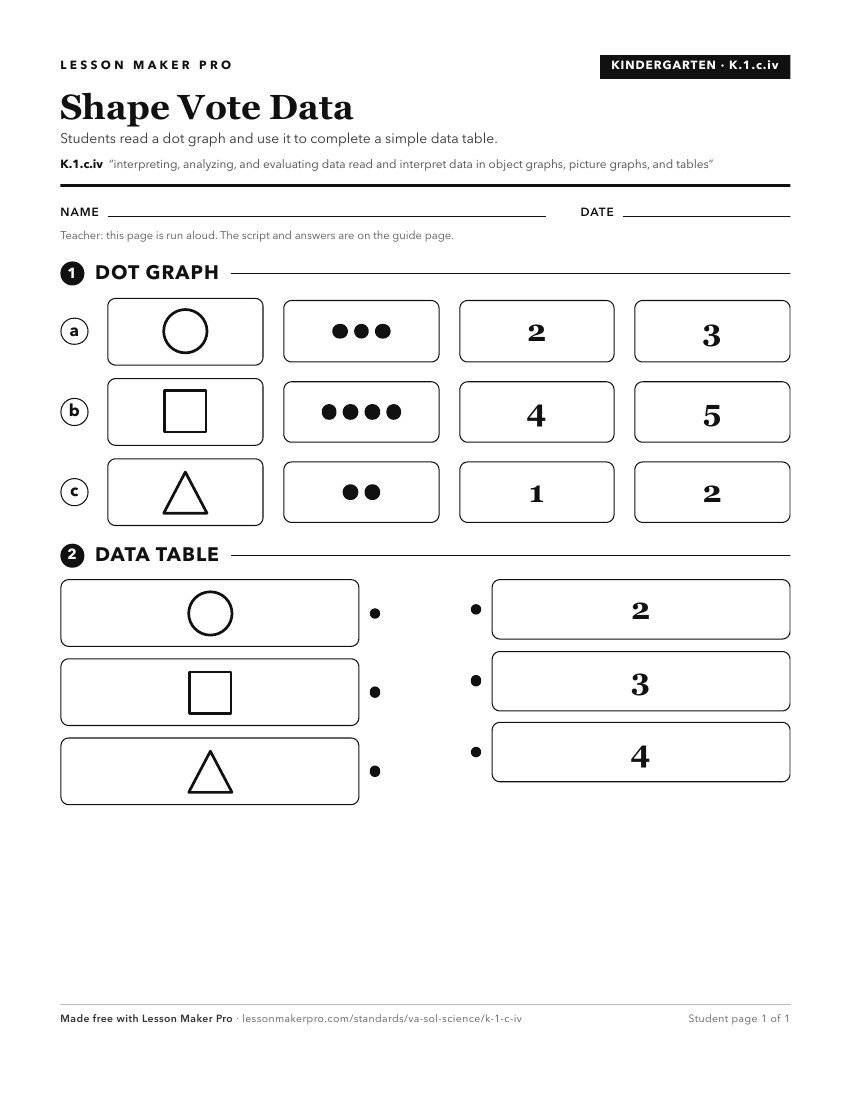
A ready-to-print activity worksheet aligned to K.1.c.iv, with an answer key for the teacher on its own page. No account needed.
PDF, US Letter, prints cleanly in black and white.
Download the worksheetKeep exploring
Related Standards
- 3.1.c.ii
read, interpret, and analyze data represented in pictographs and bar graphs
- 6.1.c.ii
construct, analyze, and interpret graphical displays of data
- 1.1.c.iv
organize and represent various forms of data using tables, picture graphs, and object graphs
- 2.1.c.ii
read and interpret data represented in pictographs and bar graphs
Turn this exact standard into a lesson
Grade, subject, topic, and the complete standard are prefilled. Create one free, no account needed.
Also for this standard:Make a WorksheetMake a QuizMake a Sub Lesson