Virginia SOL 6.1.c.ii
The Standard
- 6.1
- The student will demonstrate an understanding of scientific and engineering practices by
interpreting, analyzing, and evaluating data construct, analyze, and interpret graphical displays of data
Virginia Standards of Learning for Science · The student will demonstrate an understanding of scientific and engineering practices by
Teacher's field guide
What This Standard Means
What Students Need to Do
- Students turn data tables into clear graphs with titles, labeled axes, units, and even scales. They choose a suitable graph type and identify patterns, changes, and unusual points. They use the graph to support a conclusion.
What Mastery Looks Like
- A student can create an accurate graph without skipping data or changing scale intervals. The student can compare values, describe a trend, and explain whether the data support a stated claim.
Common Misconceptions
- Students may place variables on the wrong axes, use uneven scale intervals, or leave out units. They may describe single points instead of the overall pattern. Some treat correlation as proof that one variable caused the other.
How to Assess It
- Give students this table: time in minutes, 0, 2, 4, 6, 8; temperature in °C, 20, 24, 29, 33, 38. Ask them to graph it and write one evidence-based conclusion.
Lesson moves
Ways to Teach It
Measure water temperature every two minutes as ice melts, then make a line graph and label axes, units, scale, and title.
Show two graphs of the same data with different scales and ask, "Which graph gives the clearest picture, and why?"
Give teams data-table and graph cards to match, then have them correct one graph with a mislabeled axis or uneven scale.
Use a seven-day local temperature table to graph daily changes and identify the warmest day and the largest temperature change.
Free download
Printable 6.1.c.ii Worksheet
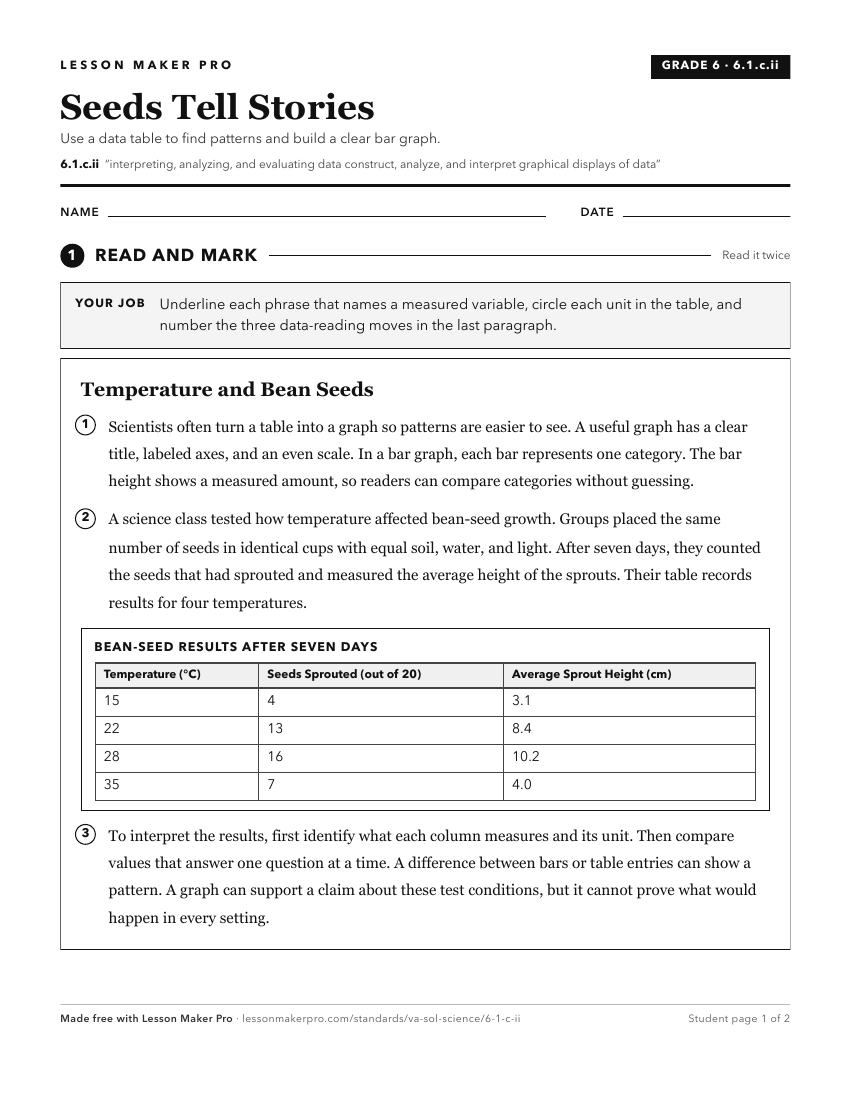
A ready-to-print activity worksheet aligned to 6.1.c.ii, with an answer key for the teacher on its own page. No account needed.
PDF, US Letter, prints cleanly in black and white.
Download the worksheetKeep exploring
Related Standards
- K.1.c.iv
read and interpret data in object graphs, picture graphs, and tables
- LS.1.c.ii
construct, analyze, and interpret graphical displays of data
- PS.1.c.ii
construct, analyze, and interpret graphical displays of data and consider limitations of data analysis
- 4.1.c.ii
interpret and analyze data represented in bar graphs and line graphs
Turn this exact standard into a lesson
Grade, subject, topic, and the complete standard are prefilled. Create one free, no account needed.
Also for this standard:Make a WorksheetMake a QuizMake a Sub Lesson