Virginia SOL LS.1.c.ii
The Standard
- LS.1
- The student will demonstrate an understanding of scientific and engineering practices by
interpreting, analyzing, and evaluating data construct, analyze, and interpret graphical displays of data
Virginia Standards of Learning for Science · The student will demonstrate an understanding of scientific and engineering practices by
Teacher's field guide
What This Standard Means
What Students Need to Do
- Students turn life science measurements into clear bar, line, or scatter graphs with labeled axes, units, and sensible scales. They identify trends, compare groups, notice unusual values, and decide whether the data support a claim.
What Mastery Looks Like
- A student selects a suitable graph type and plots the data accurately. The student describes the pattern with specific evidence and explains any limits or unusual results.
Common Misconceptions
- Students may switch the independent and dependent variables, use uneven scales, or leave off units. They may treat correlation as proof of cause or make a claim based on one data point.
How to Assess It
- Give students plant growth data for four light levels and ask them to make a graph. Have them write one supported claim and identify one data point that does not fit the pattern.
Lesson moves
Ways to Teach It
Measure pulse rates before and after one minute of exercise, then create a graph and compare changes across the class.
Show two graphs of the same data and ask, "Which graph communicates the pattern more clearly, and what specific features help?"
Run a graph-matching relay where teams pair data tables with graphs, trend statements, and supported conclusions.
Examine a local mosquito population graph and use rainfall data to explain patterns without claiming that rainfall alone caused each change.
Free download
Printable LS.1.c.ii Worksheet
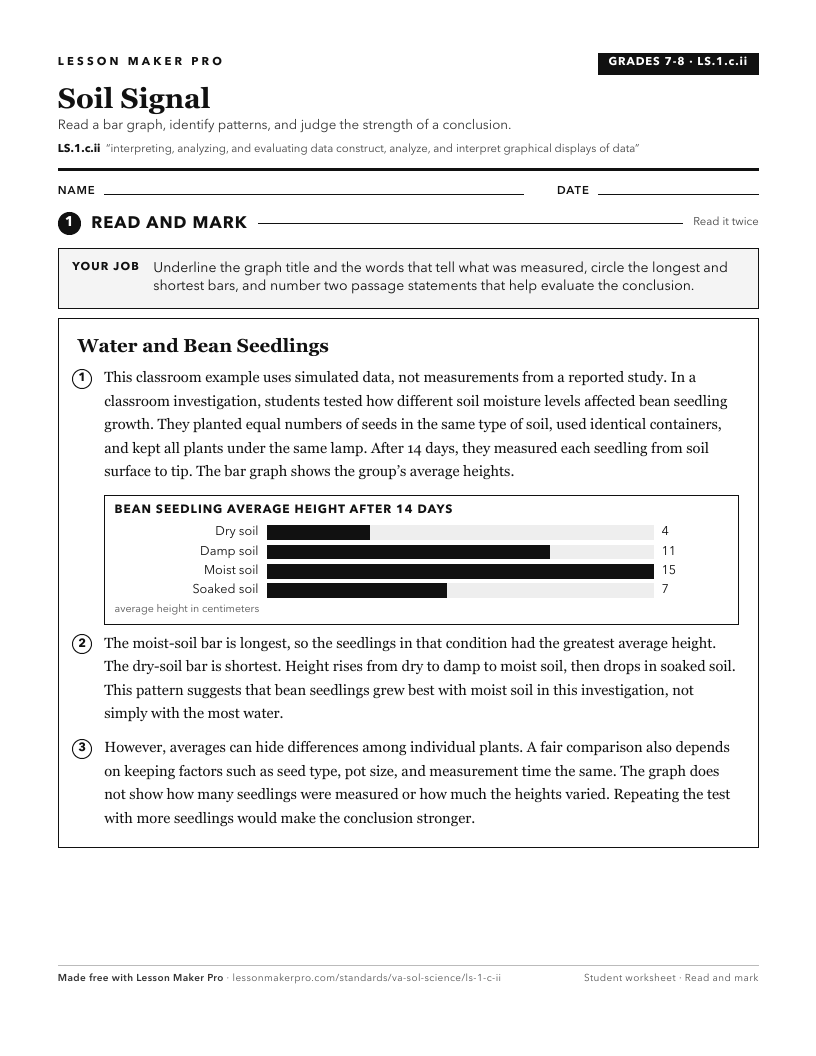
A ready-to-print activity worksheet aligned to LS.1.c.ii, with an answer key for the teacher on its own page. No account needed.
PDF, US Letter, prints cleanly in black and white.
Download the worksheetKeep exploring
Related Standards
- K.1.c.iv
read and interpret data in object graphs, picture graphs, and tables
- 6.1.c.ii
construct, analyze, and interpret graphical displays of data
- PS.1.c.ii
construct, analyze, and interpret graphical displays of data and consider limitations of data analysis
- 4.1.c.ii
interpret and analyze data represented in bar graphs and line graphs
Turn this exact standard into a lesson
Grade, subject, topic, and the complete standard are prefilled. Create one free, no account needed.
Also for this standard:Make a WorksheetMake a QuizMake a Sub Lesson