Virginia SOL 6.1.c
SOL Standard (Key Ideas Cluster)
- 6.1
- The student will demonstrate an understanding of scientific and engineering practices by
interpreting, analyzing, and evaluating data organize data sets to reveal patterns that suggest relationships construct, analyze, and interpret graphical displays of data compare and contrast data collected by different groups and discuss similarities and differences in findings use data to evaluate and refine design solutions
Virginia Standards of Learning for Science · The student will demonstrate an understanding of scientific and engineering practices by
Cluster contents
Key Ideas in This Standard
6.1.c is a Standards of Learning science standard. These are the key ideas and practices under it.
- 6.1.c.i
organize data sets to reveal patterns that suggest relationships
- 6.1.c.ii
construct, analyze, and interpret graphical displays of data
- 6.1.c.iii
compare and contrast data collected by different groups and discuss similarities and differences in findings
- 6.1.c.iv
use data to evaluate and refine design solutions
Teacher's field guide
What This Cluster Means
What Students Need to Do
- Students turn raw measurements into tables and graphs that make patterns easy to see. They explain what the data support, compare results from separate groups, and use evidence to decide how a design should change.
What Mastery Looks Like
- A student selects an appropriate display, labels it fully, and accurately describes trends, clusters, and outliers. The student explains differences between group results and recommends a specific design revision tied to the data.
Common Misconceptions
- Students may choose an unsuitable graph, use uneven scales, or leave off units and labels. They may describe one high point instead of the overall pattern, or claim that a pattern proves cause. When groups disagree, they may combine results without checking methods, sample size, or measurement error.
How to Assess It
- Give students a table showing test results for two bridge designs. Ask them to graph the data, identify one pattern, and recommend one design change using evidence.
Lesson moves
Ways to Teach It
Launch three paper airplane designs, record five flight distances per design, graph the results, and choose one feature to revise.
Write: Which graph best shows the class data, what pattern appears, and what evidence supports your choice?
Play Graph Match by pairing data tables with graph cards, then explain each match to a partner.
Compare local weekly temperatures from two weather sources, then discuss why the readings may differ and which source seems more reliable.
Free download
Printable 6.1.c Worksheet
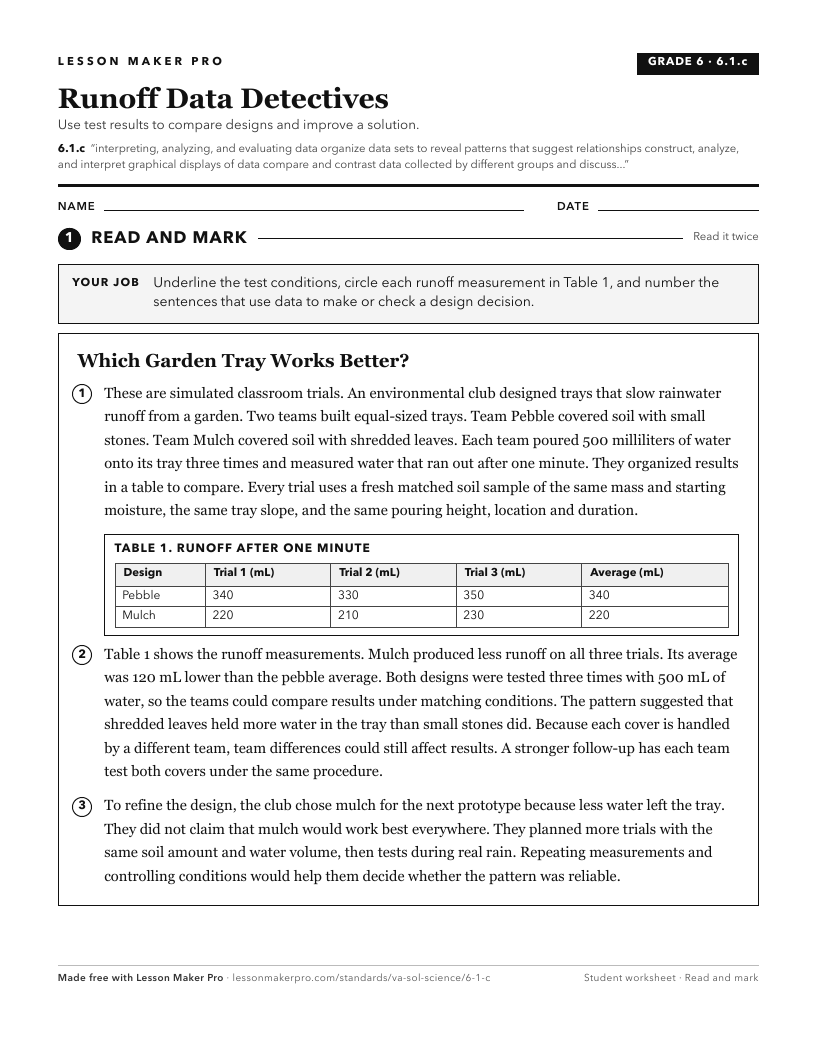
A ready-to-print activity worksheet aligned to 6.1.c, with an answer key for the teacher on its own page. No account needed.
PDF, US Letter, prints cleanly in black and white.
Download the worksheetKeep exploring
Related Standards
Turn this cluster into a lesson
Grade, subject, topic, and the complete cluster are prefilled. Create one free, no account needed.
Also for this cluster:Make a WorksheetMake a QuizMake a Sub Lesson