Virginia SOL 4.1.c
SOL Standard (Key Ideas Cluster)
- 4.1
- The student will demonstrate an understanding of scientific and engineering practices by
interpreting, analyzing, and evaluating data organize and represent data in bar graphs and line graphs interpret and analyze data represented in bar graphs and line graphs compare two different representations of the same data (e.g., a set of data displayed on a chart and a graph) analyze data from tests of an object or tool to determine whether it works as intended
Virginia Standards of Learning for Science · The student will demonstrate an understanding of scientific and engineering practices by
Cluster contents
Key Ideas in This Standard
4.1.c is a Standards of Learning science standard. These are the key ideas and practices under it.
- 4.1.c.i
organize and represent data in bar graphs and line graphs
- 4.1.c.ii
interpret and analyze data represented in bar graphs and line graphs
- 4.1.c.iii
compare two different representations of the same data (e.g., a set of data displayed on a chart and a graph)
- 4.1.c.iv
analyze data from tests of an object or tool to determine whether it works as intended
Teacher's field guide
What This Cluster Means
What Students Need to Do
- Students choose a bar graph for categories and a line graph for change over time. They label axes, use a consistent scale, compare graphs with tables, and use test results to judge a design.
What Mastery Looks Like
- A student creates an accurate graph from a data table and explains patterns using specific values. The student compares two displays of the same data and decides whether a tested object met its goal.
Common Misconceptions
- Students may choose the wrong graph type, skip axis labels, or use uneven number intervals. They may describe the tallest bar without comparing values, or claim a design works without using test data.
How to Assess It
- Give students a six-day temperature table. Ask them to create a graph, identify the greatest change, and support their answer with two values.
Lesson moves
Ways to Teach It
Test paper bridges with increasing loads, record the results, make a bar graph, and decide which bridge best met the weight goal.
Show a table and graph of plant growth, then ask students to write two similarities and one pattern supported by values.
Play a graph-matching game where students pair data tables with bar or line graphs and explain each match.
Graph a week of local temperatures, then compare the graph with the weather table used by a news station.
Free download
Printable 4.1.c Worksheet
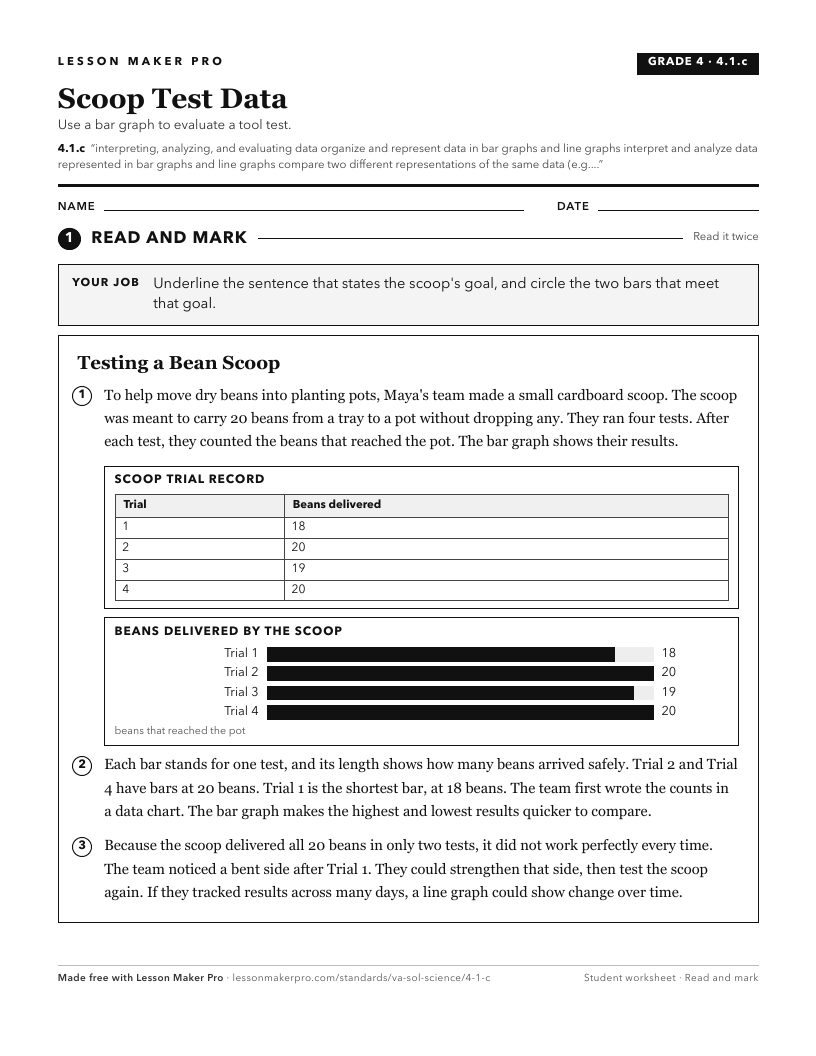
A ready-to-print activity worksheet aligned to 4.1.c, with an answer key for the teacher on its own page. No account needed.
PDF, US Letter, prints cleanly in black and white.
Download the worksheetKeep exploring
Related Standards
Turn this cluster into a lesson
Grade, subject, topic, and the complete cluster are prefilled. Create one free, no account needed.
Also for this cluster:Make a WorksheetMake a QuizMake a Sub Lesson