Texas TEKS 7.2
TEKS Knowledge Statement (Expectation Cluster)
Scientific and engineering practices. The student analyzes and interprets data to derive meaning, identify features and patterns, and discover relationships or correlations to develop evidence-based arguments or evaluate designs. The student is expected to: identify advantages and limitations of models such as their size, scale, properties, and materials; analyze data by identifying any significant descriptive statistical features, patterns, sources of error, or limitations; use mathematical calculations to assess quantitative relationships in data; and evaluate experimental and engineering designs.
Texas Essential Knowledge and Skills for Science
Cluster contents
Student Expectations in This Statement
7.2 is a TEKS knowledge and skills statement. These are the student expectations under it.
- 7.2.A
identify advantages and limitations of models such as their size, scale, properties, and materials
- 7.2.B
analyze data by identifying any significant descriptive statistical features, patterns, sources of error, or limitations
- 7.2.C
use mathematical calculations to assess quantitative relationships in data
- 7.2.D
evaluate experimental and engineering designs.
Teacher's field guide
What This Cluster Means
What Students Need to Do
- Students compare a model with the object, system, or process it represents and explain what its scale, size, properties, or materials leave out. They inspect tables and graphs for trends, clusters, outliers, variation, error sources, and limits, then use calculations to describe relationships. They use the results to judge an investigation or design and support a claim or improvement.
What Mastery Looks Like
- A student selects and calculates a useful measure, such as mean, range, rate, ratio, or percent change, and explains what it shows. They point to specific values when describing patterns, outliers, and possible errors. They compare a model or design with its purpose, name limits, and propose an evidence-based improvement.
Common Misconceptions
- Students often treat a model as an exact copy, or call every difference a flaw rather than a deliberate simplification. They may assume correlation proves cause, choose a calculation without explaining it, or ignore outliers and variation across trials. They also judge a design by appearance instead of criteria, test data, controlled variables, and constraints.
How to Assess It
- Give students a five row data table from three bridge trials plus a sketch of the bridge model. Ask them to calculate the mean load, identify one pattern or error source, name one model limitation, and recommend one design change.
Lesson moves
Ways to Teach It
Build foil boat prototypes, record maximum washer loads, calculate load per gram of foil, then name one design limitation and revise.
Show a graph linking study time and quiz scores, then ask students to write what the correlation supports and cannot prove.
Run an Error Detective card sort where teams match flawed data sets to outliers, measurement error, small samples, or uncontrolled variables.
Compare a hurricane forecast cone with the storm’s actual path, then discuss model usefulness, uncertainty, scale, and decisions officials must make.
Free download
Printable 7.2 Worksheet
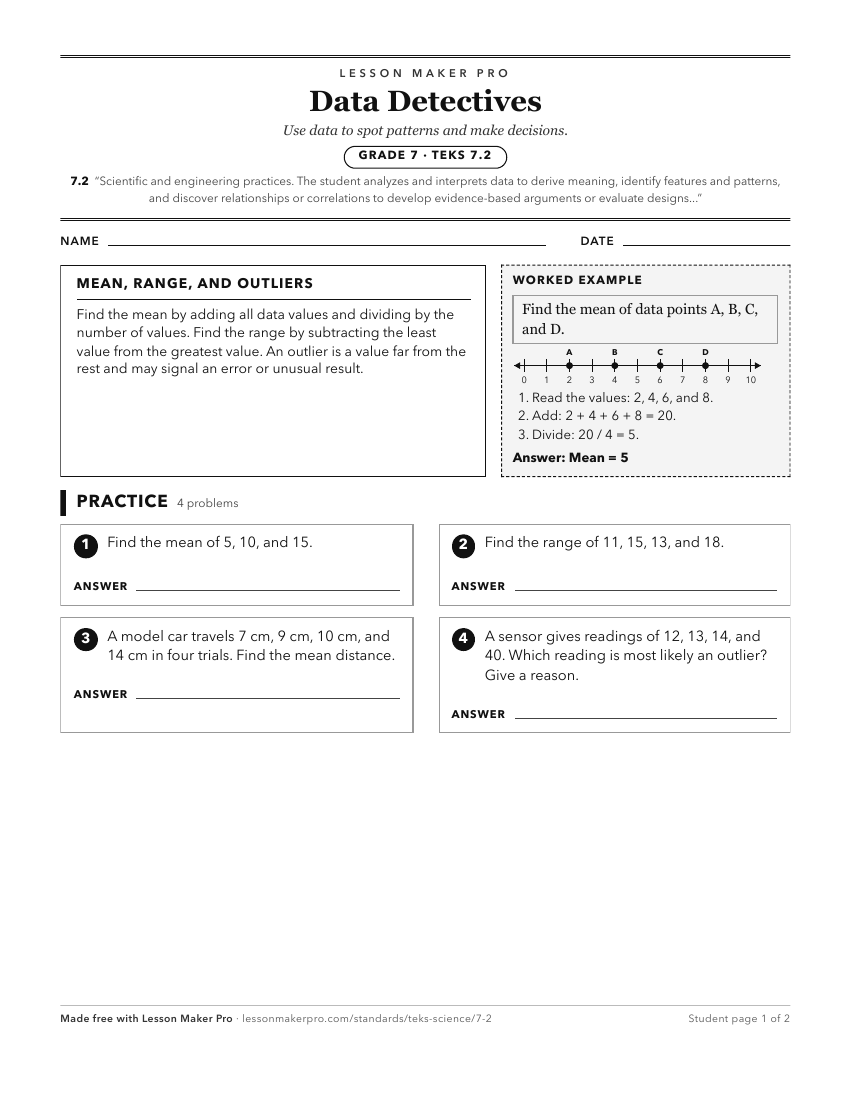
A ready-to-print activity worksheet aligned to 7.2, with an answer key for the teacher on its own page. No account needed.
PDF, US Letter, prints cleanly in black and white.
Download the worksheetKeep exploring
Related Standards
Turn this cluster into a lesson
Grade, subject, topic, and the complete cluster are prefilled. Create one free, no account needed.
Also for this cluster:Make a WorksheetMake a QuizMake a Sub Lesson