Texas TEKS 7.2.B
The Standard
- 7.2
- Scientific and engineering practices. The student analyzes and interprets data to derive meaning, identify features and patterns, and discover relationships or correlations to develop evidence-based arguments or evaluate designs. The student is expected to:
analyze data by identifying any significant descriptive statistical features, patterns, sources of error, or limitations
Texas Essential Knowledge and Skills for Science
Teacher's field guide
What This Standard Means
What Students Need to Do
- Students summarize a data set using measures such as mean, median, mode, range, and outliers. They describe trends, then identify possible measurement errors, sampling problems, and limits on the conclusions.
What Mastery Looks Like
- A student selects useful statistics and explains what they show about the data. The student spots patterns and outliers, suggests plausible errors, and states conclusions that fit the sample.
Common Misconceptions
- Students may treat every outlier as a mistake or assume a pattern proves cause and effect. They may rely on the mean when an outlier makes the median more useful. They may also confuse a study limitation, such as a small sample, with a measurement error.
How to Assess It
- Give this exit ticket: Plant heights are 12, 13, 14, 14, 15, and 28 cm. Find the median and range, identify an outlier, and name one possible error or limitation.
Lesson moves
Ways to Teach It
Have teams measure one desk five times, graph the results, calculate the range, and explain why the measurements differ.
Show two graphs of the same data with different scales, then ask students which claims each graph seems to support.
Give groups data cards and award points for correctly naming the center, spread, pattern, outlier, error, and limitation.
Analyze one month of local temperatures, identify a trend or unusual day, and discuss what the data cannot explain.
Free download
Printable 7.2.B Worksheet
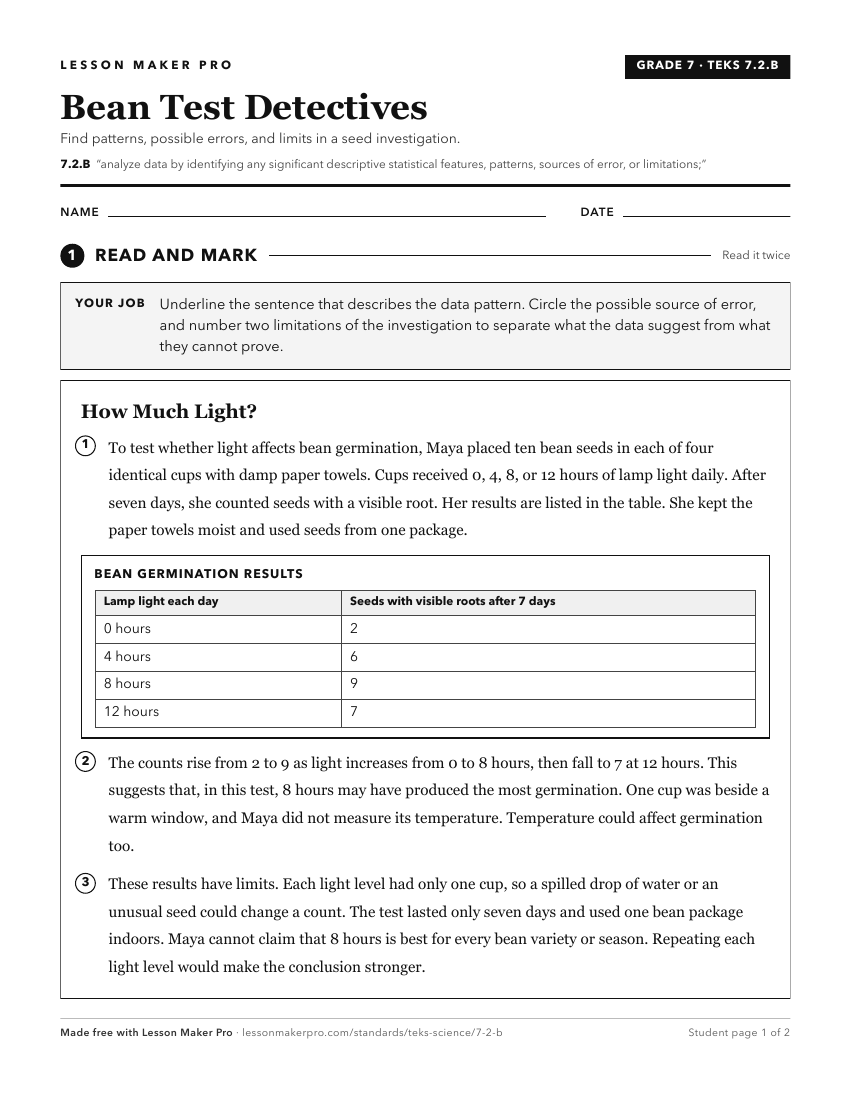
A ready-to-print activity worksheet aligned to 7.2.B, with an answer key for the teacher on its own page. No account needed.
PDF, US Letter, prints cleanly in black and white.
Download the worksheetKeep exploring
Related Standards
- 6.2.B
The 6th Grade version of this standard.
- 8.2.B
analyze data by identifying any significant descriptive statistical features, patterns, sources of error, or limitations
- 4.2.B
analyze data by identifying any significant features, patterns, or sources of error
- 3.2.B
analyze data by identifying any significant features, patterns, or sources of error
Turn this exact standard into a lesson
Grade, subject, topic, and the complete standard are prefilled. Create one free, no account needed.
Also for this standard:Make a WorksheetMake a QuizMake a Sub Lesson