TEKS Math 6.12
Knowledge and Skills Statement (Standard Cluster)
The student applies mathematical process standards to use numerical or graphical representations to analyze problems
Texas Essential Knowledge and Skills for Mathematics
Cluster contents
Student Expectations in This Statement
6.12 is a knowledge and skills statement. These are the student expectations under it.
- 6.12.A
represent numeric data graphically, including dot plots, stem-and-leaf plots, histograms, and box plots
- 6.12.B
use the graphical representation of numeric data to describe the center, spread, and shape of the data distribution
- 6.12.C
summarize numeric data with numerical summaries, including the mean and median (measures of center) and the range and interquartile range (IQR) (measures of spr...
- 6.12.D
summarize categorical data with numerical and graphical summaries, including the mode, the percent of values in each category (relative frequency table), and th...
Teacher's field guide
What This Cluster Means
What Students Need to Do
- Students organize numerical data in dot plots, stem-and-leaf plots, histograms, and box plots. They calculate mean, median, range, and IQR, then describe patterns in the distribution. They also summarize category counts with modes, percentages, relative frequency tables, and percent bar graphs.
What Mastery Looks Like
- Given a data set, students can build an accurate requested graph and calculate the correct summaries. They use the graph and calculations to explain a typical value, variability, skew, clusters, gaps, or outliers. For categorical data, they find the mode and convert counts to percentages that total 100 percent.
Common Misconceptions
- Students may leave gaps between histogram bars or use category labels on a histogram. They may confuse mean with median, range with IQR, or split the ordered data incorrectly when finding quartiles. They may divide category counts by the wrong total or call the tallest category the mean instead of the mode.
How to Assess It
- Exit ticket: For 1, 2, 3, 3, 4, 5, 6, 8, draw a dot plot, find the mean, median, range, and IQR, then describe the shape. For survey counts cats 8, dogs 6, fish 4, birds 2, identify the mode and write each category as a percent.
Lesson moves
Ways to Teach It
Measure classmates’ hand spans, place sticky notes on a floor number line, then use the same data to build a box plot.
Show two histograms with equal medians but different spreads, and ask students which group is more consistent and why.
Run a card sort matching data sets, graphs, and summary cards, then have pairs justify one match before earning a point.
Use cafeteria survey counts to make a percent bar graph, identify the mode, and explain what the percentages show about student choices.
Free download
Printable 6.12 Worksheet
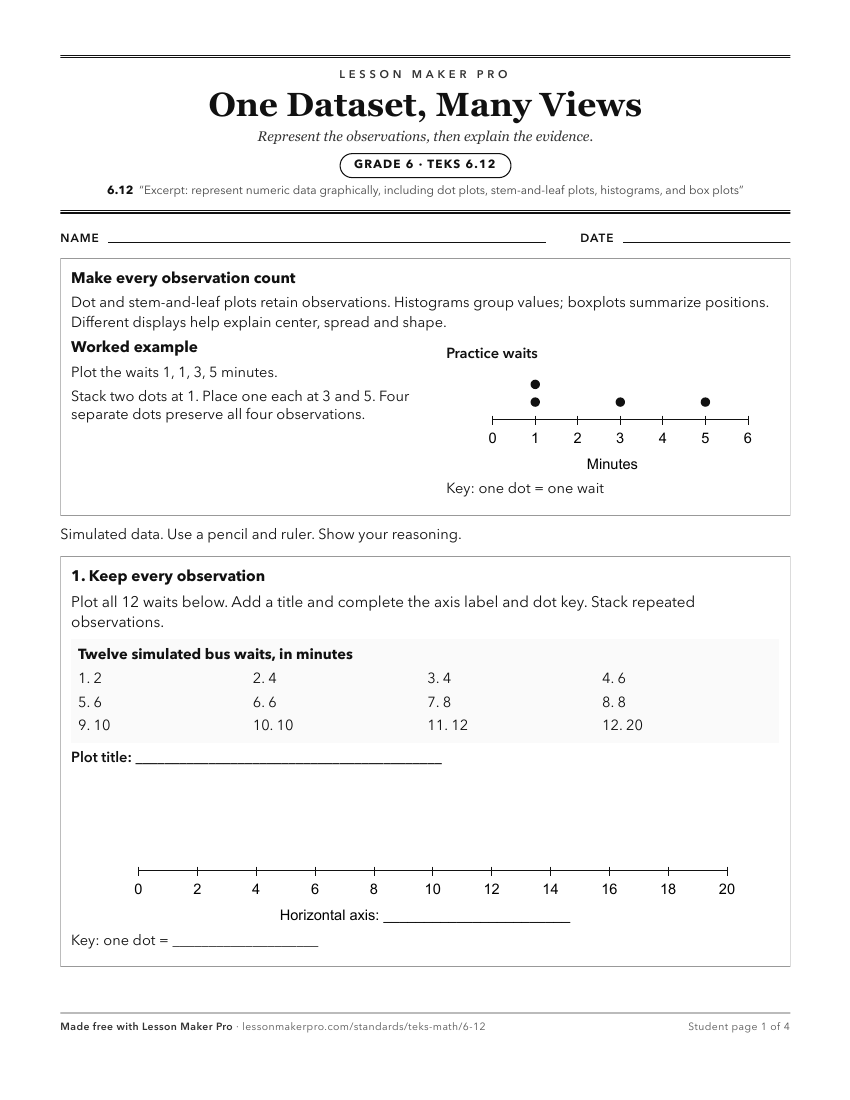
A ready-to-print activity worksheet aligned to 6.12, with an answer key for the teacher on its own page. No account needed.
PDF, US Letter, prints cleanly in black and white.
Download the worksheetKeep exploring
Related Standards
- 6.13
The student applies mathematical process standards to use numerical or graphical representations to solve problems
- 3.8
The student applies mathematical process standards to solve problems by collecting, organizing, displaying, and interpreting data
- 4.9
The student applies mathematical process standards to solve problems by collecting, organizing, displaying, and interpreting data
- 7.12
The student applies mathematical process standards to use statistical representations to analyze data
Turn this cluster into a lesson
Grade, subject, topic, and the complete cluster are prefilled. Create one free, no account needed.
Also for this cluster:Make a WorksheetMake a QuizMake a Sub Lesson