TEKS Math 7.12
Knowledge and Skills Statement (Standard Cluster)
The student applies mathematical process standards to use statistical representations to analyze data
Texas Essential Knowledge and Skills for Mathematics
Cluster contents
Student Expectations in This Statement
7.12 is a knowledge and skills statement. These are the student expectations under it.
- 7.12.A
compare two groups of numeric data using comparative dot plots or box plots by comparing their shapes, centers, and spreads
- 7.12.B
use data from a random sample to make inferences about a population
- 7.12.C
compare two populations based on data in random samples from these populations, including informal comparative inferences about differences between the two popu...
Teacher's field guide
What This Cluster Means
What Students Need to Do
- Students read comparative dot plots and box plots, then describe differences in shape, center, and spread. They use random samples to make reasonable claims about one population or compare two populations.
What Mastery Looks Like
- Students accurately compare medians, ranges, interquartile ranges, clusters, gaps, and skew when shown two plots. They use sample results to make a reasonable population claim and explain why the sampling method matters.
Common Misconceptions
- Students may compare only the highest values and ignore center, spread, or shape. They may confuse range with interquartile range, treat a sample as the whole population, or assume any sample is random.
How to Assess It
- Give students two box plots from random samples. Ask them to compare center and spread, describe one shape feature, and write one supported population inference.
Lesson moves
Ways to Teach It
Have pairs randomly draw numbered tiles from two bags, make dot plots, and compare each sample's center, spread, and shape.
Ask students to write which of two groups appears more consistent, citing two specific features from the plots.
Play Plot Match by having teams pair data sets with box plots, then justify each match using medians and quartiles.
Compare random samples of lunch wait times from two school days and decide which day likely has shorter waits overall.
Free download
Printable 7.12 Worksheet
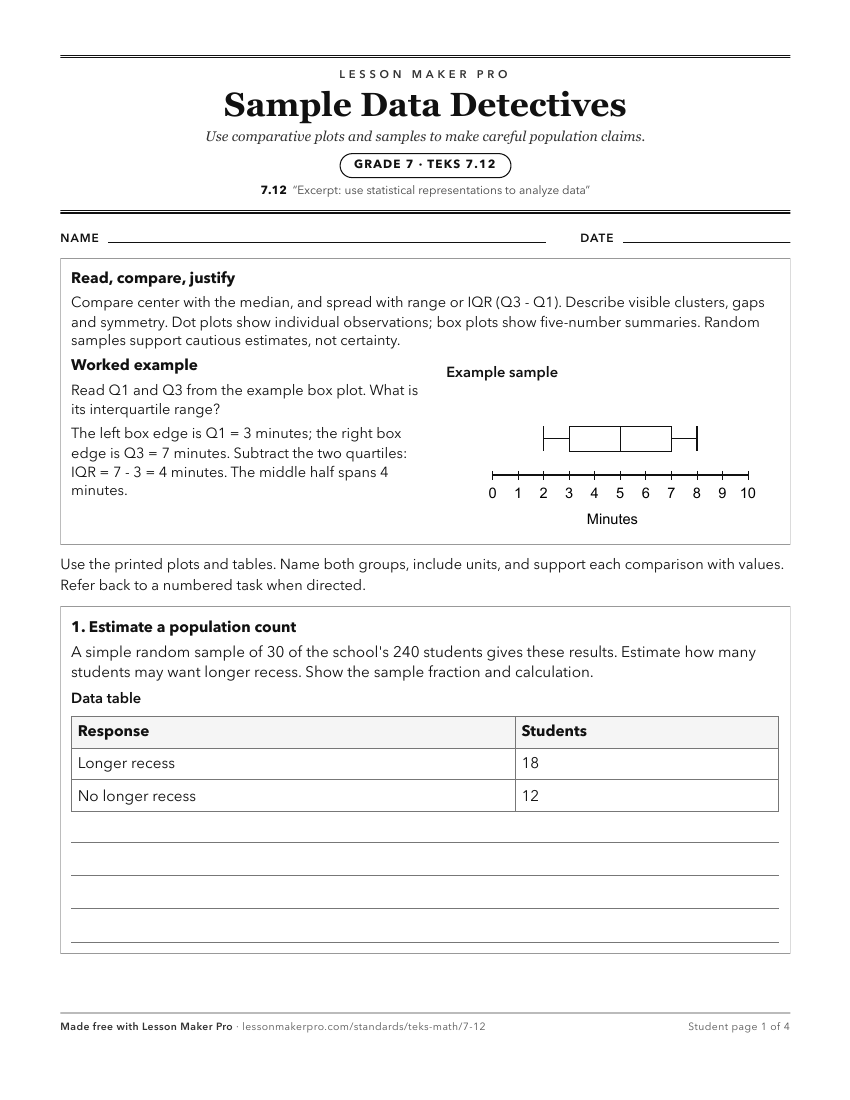
A ready-to-print activity worksheet aligned to 7.12, with an answer key for the teacher on its own page. No account needed.
PDF, US Letter, prints cleanly in black and white.
Download the worksheetKeep exploring
Related Standards
- 3.8
The student applies mathematical process standards to solve problems by collecting, organizing, displaying, and interpreting data
- 8.11
The student applies mathematical process standards to use statistical procedures to describe data
- 6.12
The student applies mathematical process standards to use numerical or graphical representations to analyze problems
- 4.9
The student applies mathematical process standards to solve problems by collecting, organizing, displaying, and interpreting data
Turn this cluster into a lesson
Grade, subject, topic, and the complete cluster are prefilled. Create one free, no account needed.
Also for this cluster:Make a WorksheetMake a QuizMake a Sub Lesson