TEKS Math 8.11
Knowledge and Skills Statement (Standard Cluster)
The student applies mathematical process standards to use statistical procedures to describe data
Texas Essential Knowledge and Skills for Mathematics
Cluster contents
Student Expectations in This Statement
8.11 is a knowledge and skills statement. These are the student expectations under it.
- 8.11.A
construct a scatterplot and describe the observed data to address questions of association such as linear, non-linear, and no association between bivariate data
- 8.11.B
determine the mean absolute deviation and use this quantity as a measure of the average distance data are from the mean using a data set of no more than 10 data...
- 8.11.C
simulate generating random samples of the same size from a population with known characteristics to develop the notion of a random sample being representative o...
Teacher's field guide
What This Cluster Means
What Students Need to Do
- Students plot paired numerical data and describe the overall pattern as linear, nonlinear, or no association. They calculate mean absolute deviation as the average distance from the mean. They simulate repeated random samples of equal size and compare each sample with the known population.
What Mastery Looks Like
- Students accurately graph paired values and identify linear, nonlinear, or no association from the overall pattern. They calculate the mean, find each absolute deviation, and average those deviations correctly. They use repeated, equal-sized random samples to explain why results vary and when samples reasonably reflect a population.
Common Misconceptions
- Students may connect scatterplot points, treat any upward pattern as perfectly linear, or claim association proves causation. They may average signed deviations and get zero, or divide by the wrong number. They may choose convenient subjects instead of sampling randomly, or expect every sample to match the population exactly.
How to Assess It
- Exit ticket: plot (1,2), (2,4), (3,6), and (4,8); find the MAD of 2, 4, 4, 6, 9; then use digit strings 18257, 03649, and 55128 to simulate samples from a 60% red population, with digits 0 through 5 representing red. Name the association, report the MAD, and state whether every sample matched the population proportion.
Lesson moves
Ways to Teach It
Students measure hand span and height for 10 classmates, plot the pairs, then describe the form and direction of the association.
Ask, “Two data sets have the same mean but different MADs. What does that tell you?” Students answer with a numerical example.
Run a card sort matching scatterplots to linear, nonlinear, or no association, then have partners justify one disputed match.
Simulate a school poll by drawing 10 counters from a bag with 18 blue and 12 yellow, replacing each sample, then compare proportions.
Free download
Printable 8.11 Worksheet
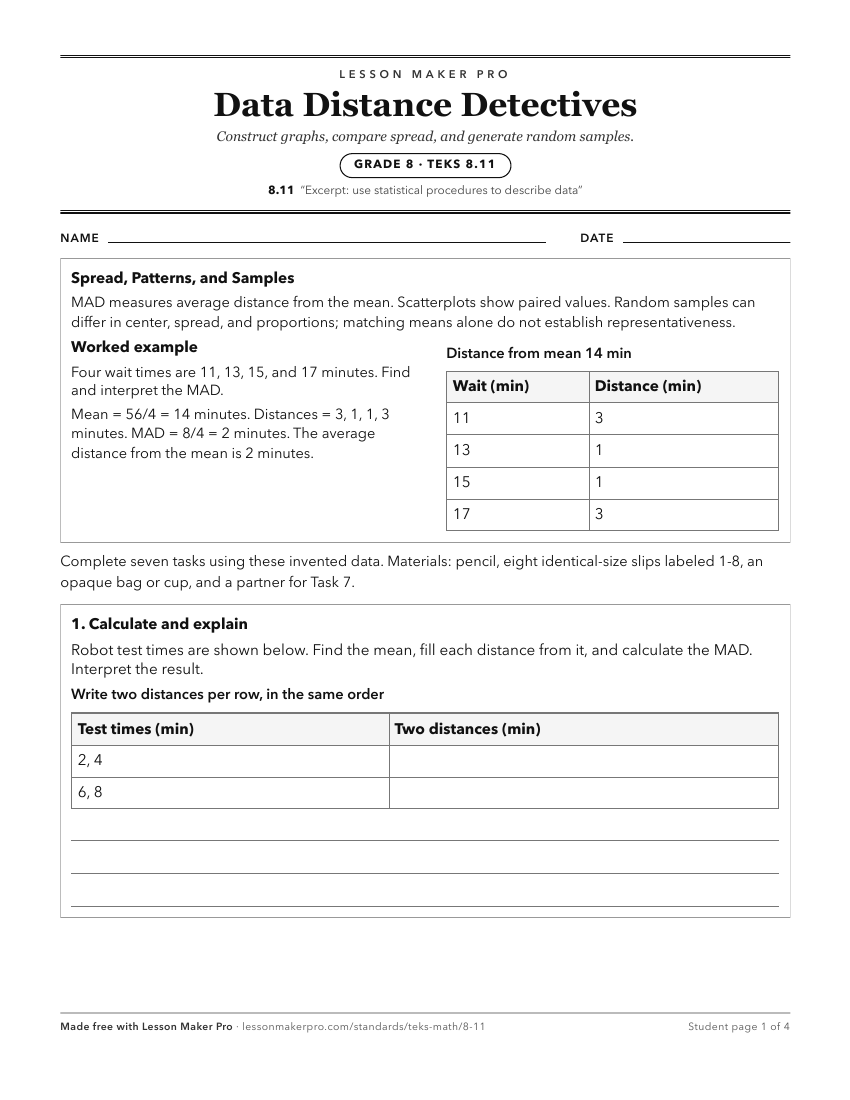
A ready-to-print activity worksheet aligned to 8.11, with an answer key for the teacher on its own page. No account needed.
PDF, US Letter, prints cleanly in black and white.
Download the worksheetKeep exploring
Related Standards
- K.8
The student applies mathematical process standards to collect and organize data to make it useful for interpreting information
- 3.8
The student applies mathematical process standards to solve problems by collecting, organizing, displaying, and interpreting data
- 4.9
The student applies mathematical process standards to solve problems by collecting, organizing, displaying, and interpreting data
- 7.12
The student applies mathematical process standards to use statistical representations to analyze data
Turn this cluster into a lesson
Grade, subject, topic, and the complete cluster are prefilled. Create one free, no account needed.
Also for this cluster:Make a WorksheetMake a QuizMake a Sub Lesson