TEKS Math 3.8
Knowledge and Skills Statement (Standard Cluster)
The student applies mathematical process standards to solve problems by collecting, organizing, displaying, and interpreting data
Texas Essential Knowledge and Skills for Mathematics
Cluster contents
Student Expectations in This Statement
3.8 is a knowledge and skills statement. These are the student expectations under it.
Teacher's field guide
What This Cluster Means
What Students Need to Do
- Students collect and sort categorical data, then show it in frequency tables, dot plots, pictographs, and scaled bar graphs. They read these displays to solve one-step and two-step problems.
What Mastery Looks Like
- Students organize categorical data accurately in a frequency table, dot plot, pictograph, or scaled bar graph. They use titles, labels, keys, and scales correctly, then solve one-step and two-step questions using the display.
Common Misconceptions
- Students may count symbols instead of using the pictograph key, or read each bar interval as one. They may also combine categories incorrectly or answer a two-step question after completing only the first step.
How to Assess It
- Give students a bar graph with intervals of 5 and four categories. Ask, “How many more students chose apples and bananas together than oranges?”
Lesson moves
Ways to Teach It
Survey classmates about favorite recess activities, tally the results, then build a frequency table and scaled bar graph.
Display two graphs of the same data and ask, “Which is easier to read, and what evidence supports your choice?”
Play Graph Detective by giving pairs data displays and question cards worth one point for each correct answer and explanation.
Use a school lunch survey to compare meal choices and calculate how many more students chose two options combined than a third.
Free download
Printable 3.8 Worksheet
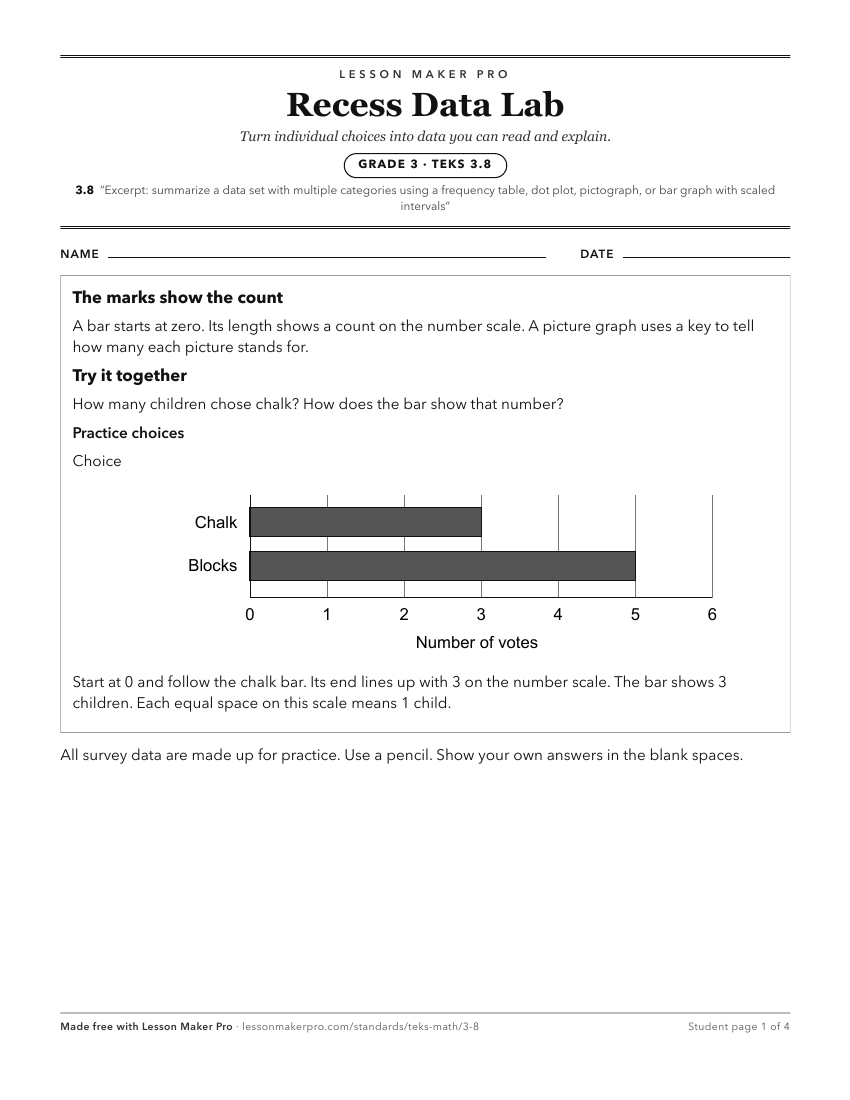
A ready-to-print activity worksheet aligned to 3.8, with an answer key for the teacher on its own page. No account needed.
PDF, US Letter, prints cleanly in black and white.
Download the worksheetKeep exploring
Related Standards
- 1.8
The student applies mathematical process standards to organize data to make it useful for interpreting information and solving problems
- K.8
The student applies mathematical process standards to collect and organize data to make it useful for interpreting information
- 5.9
The 5th Grade version of this standard.
- 4.9
The 4th Grade version of this standard.
Turn this cluster into a lesson
Grade, subject, topic, and the complete cluster are prefilled. Create one free, no account needed.
Also for this cluster:Make a WorksheetMake a QuizMake a Sub Lesson