TEKS Math 5.9
Knowledge and Skills Statement (Standard Cluster)
The student applies mathematical process standards to solve problems by collecting, organizing, displaying, and interpreting data
Texas Essential Knowledge and Skills for Mathematics
Cluster contents
Student Expectations in This Statement
5.9 is a knowledge and skills statement. These are the student expectations under it.
- 5.9.A
represent categorical data with bar graphs or frequency tables and numerical data, including data sets of measurements in fractions or decimals, with dot plots ...
- 5.9.B
represent discrete paired data on a scatterplot
- 5.9.C
solve one- and two-step problems using data from a frequency table, dot plot, bar graph, stem-and-leaf plot, or scatterplot
Teacher's field guide
What This Cluster Means
What Students Need to Do
- Students decide whether a data set contains categories, single measurements, or paired measurements. They match each type to a useful graph or table. They use displayed values to compare counts, find differences, and answer multi-step questions.
What Mastery Looks Like
- Students select a suitable display without being told which one to use. Their labels, scales, stems, leaves, and plotted points are accurate. They can support answers to one-step and two-step questions with values from the display.
Common Misconceptions
- Students may graph categories on a number line or treat decimal measurements as categories. They may reverse stems and leaves, skip repeated values, or plot paired values as separate points. They may also assume every scatterplot shows a clear relationship.
How to Assess It
- Give students the measurements 2.5, 2.75, 2.5, 3, 3.25, and 2.75. Ask them to make a dot plot, then find how many measurements are below 3 and how many more are at least 3.
Lesson moves
Ways to Teach It
Have students measure six classroom objects to the nearest tenth, build a class dot plot, and answer two comparison questions.
Ask students to explain in writing why favorite lunch choices need a bar graph while height and arm span need a scatterplot.
Play Data Display Match with cards showing data sets, graph types, and completed displays for students to sort into matching groups.
Survey lunch choices and record paired homework time and bedtime data, then create a bar graph and scatterplot for a class report.
Free download
Printable 5.9 Worksheet
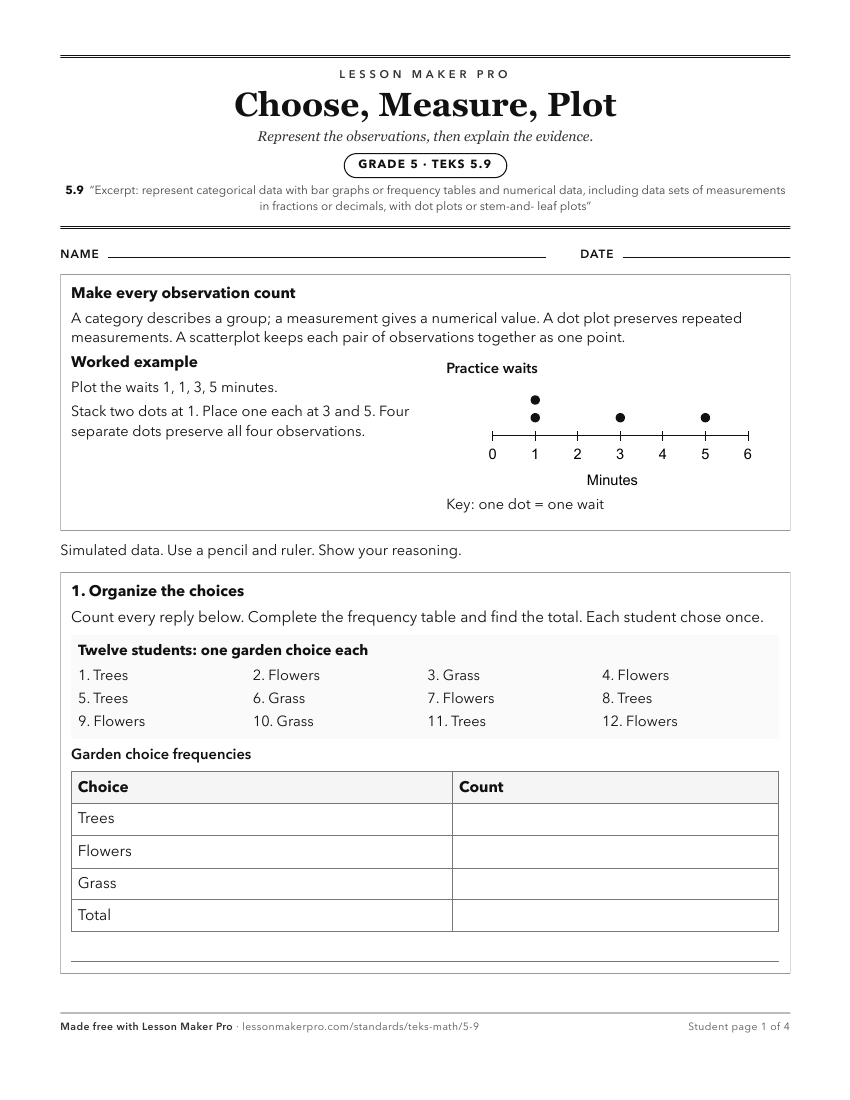
A ready-to-print activity worksheet aligned to 5.9, with an answer key for the teacher on its own page. No account needed.
PDF, US Letter, prints cleanly in black and white.
Download the worksheetKeep exploring
Related Standards
- 1.8
The student applies mathematical process standards to organize data to make it useful for interpreting information and solving problems
- K.8
The student applies mathematical process standards to collect and organize data to make it useful for interpreting information
- 3.8
The 3rd Grade version of this standard.
- 4.9
The 4th Grade version of this standard.
Turn this cluster into a lesson
Grade, subject, topic, and the complete cluster are prefilled. Create one free, no account needed.
Also for this cluster:Make a WorksheetMake a QuizMake a Sub Lesson