TEKS Math 6.13
Knowledge and Skills Statement (Standard Cluster)
The student applies mathematical process standards to use numerical or graphical representations to solve problems
Texas Essential Knowledge and Skills for Mathematics
Cluster contents
Student Expectations in This Statement
6.13 is a knowledge and skills statement. These are the student expectations under it.
Teacher's field guide
What This Cluster Means
What Students Need to Do
- Students read dot plots, stem-and-leaf plots, histograms, and box plots to describe center, spread, frequency, clusters, and gaps. They use those features to answer questions and decide whether values vary.
What Mastery Looks Like
- Students accurately identify values, frequencies, clusters, gaps, medians, quartiles, and ranges when the display provides them. They compare data sets using evidence from the graphs. They recognize that identical values have no variability and differing values do.
Common Misconceptions
- Students may treat histogram bars as individual data points or assume gaps between bars are missing values. They may read box plot sections as equal ranges rather than equal portions of the data. They may think any list with several values has variability, even when every value is the same.
How to Assess It
- Give students one box plot and two small data sets. Ask them to find the median and spread, describe one pattern, and identify which data set has no variability.
Lesson moves
Ways to Teach It
Measure each student's hand span, make a class dot plot, and label the mode, range, clusters, and gaps.
Show two histograms and ask, “Which group is more consistent, and what evidence from the graphs supports your answer?”
Give teams matching cards with data sets, dot plots, stem-and-leaf plots, histograms, and box plots to pair correctly.
Compare box plots of wait times at two clinics, then have students recommend a clinic and support the choice with data.
Free download
Printable 6.13 Worksheet
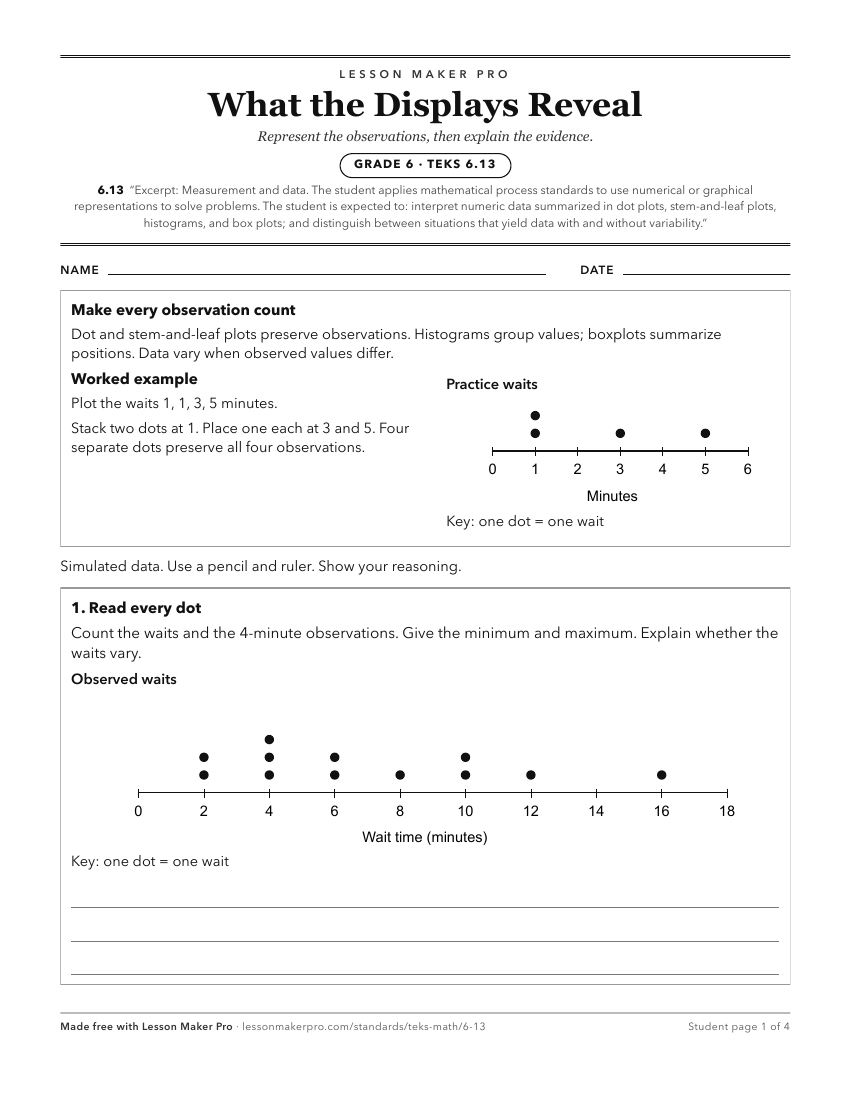
A ready-to-print activity worksheet aligned to 6.13, with an answer key for the teacher on its own page. No account needed.
PDF, US Letter, prints cleanly in black and white.
Download the worksheetKeep exploring
Related Standards
- 3.8
The student applies mathematical process standards to solve problems by collecting, organizing, displaying, and interpreting data
- 6.12
The student applies mathematical process standards to use numerical or graphical representations to analyze problems
- 4.9
The student applies mathematical process standards to solve problems by collecting, organizing, displaying, and interpreting data
- 7.12
The student applies mathematical process standards to use statistical representations to analyze data
Turn this cluster into a lesson
Grade, subject, topic, and the complete cluster are prefilled. Create one free, no account needed.
Also for this cluster:Make a WorksheetMake a QuizMake a Sub Lesson