Oklahoma Social Studies WG.C.2
Standard Cluster
Analyze how the human population is organized geographically in order to understand how change affects human systems. Interpret geographic data measuring population including density, distribution, patterns of composition, and population trends and projections to analyze issues related to population change. Examine common characteristics of urban versus rural communities, including the patterns and impact of modern migration to urban centers and megacities. Explain the push and pull theory of migration and its impact on human capital and demographic transitions, including the consequences of major voluntary and involuntary migrations.
Oklahoma Academic Standards for Social Studies (2026)
Cluster contents
Standards in This Cluster
WG.C.2 is a cluster heading. These are the individual standards under it.
- WG.C.2.1
Interpret geographic data measuring population including density, distribution, patterns of composition, and population trends and projections to analyze issues...
- WG.C.2.2
Examine common characteristics of urban versus rural communities, including the patterns and impact of modern migration to urban centers and megacities.
- WG.C.2.3
Explain the push and pull theory of migration and its impact on human capital and demographic transitions, including the consequences of major voluntary and inv...
Teacher's field guide
What This Cluster Means
What Students Need to Do
- Students use maps, age charts, and projections to describe where people live and how populations change. They compare rural areas, cities, and megacities. They explain why people move, by choice or by force, and how migration changes jobs and age groups.
What Mastery Looks Like
- Given a map and age charts, a student identifies a growing city and cites numbers. They distinguish a move for work from displacement by war. They predict changes in housing demand, workforce skills, and age groups.
Common Misconceptions
- Students may mistake total population for density or assume all rural areas are shrinking. They may swap push and pull factors or assume everyone chooses to move. They may treat a population projection as a certain outcome.
How to Assess It
- Exit ticket: City A has 4 million people on 400 square kilometers. Rural B has 100,000 people on 2,000 square kilometers. Ask which place is denser, then name one reason people might move from B to A and one likely effect on A.
Lesson moves
Ways to Teach It
Give pairs a blank grid map, population totals for four districts, and counters; have them model density and mark the densest district.
Ask: A drought drives farmers toward a megacity with factory jobs. Which factor pushes, which pulls, and what changes for both places?
Play migration match: hand out cards labeled drought, new jobs, war, or family ties; teams sort each as push or pull and explain.
Use Census QuickFacts for two nearby counties; compare growth and child shares, then predict which county may need more school seats.
Free download
Printable WG.C.2 Worksheet
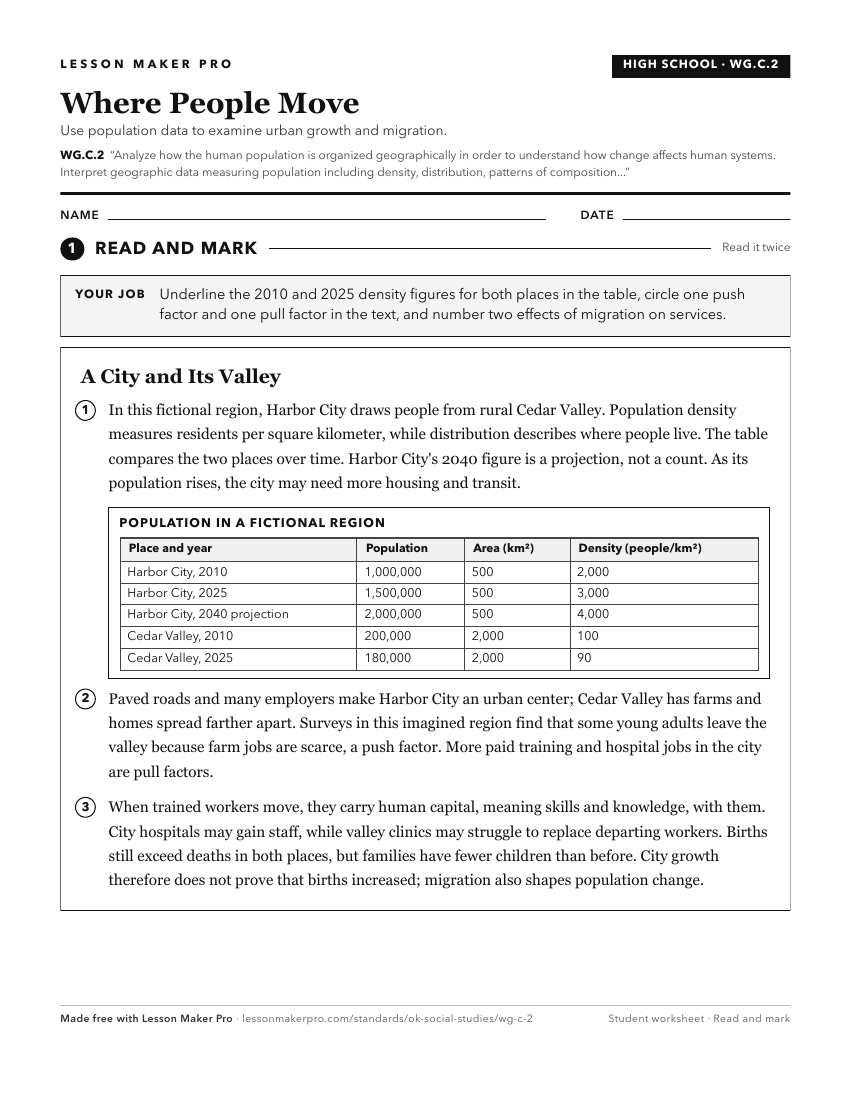
A ready-to-print activity worksheet aligned to WG.C.2, with an answer key for the teacher on its own page. No account needed.
PDF, US Letter, prints cleanly in black and white.
Download the worksheetKeep exploring
Related Standards
Turn this cluster into a lesson
Grade, subject, topic, and the complete cluster are prefilled. Create one free, no account needed.
Also for this cluster:Make a WorksheetMake a QuizMake a Sub Lesson