Oklahoma Social Studies WG.C.2.1
The Standard
- WG.C.2
- Analyze how the human population is organized geographically in order to understand how change affects human systems.
Interpret geographic data measuring population including density, distribution, patterns of composition, and population trends and projections to analyze issues related to population change.
Oklahoma Academic Standards for Social Studies (2026) · WG.C.2
Teacher's field guide
What This Standard Means
What Students Need to Do
- Students read population maps, age charts, and graphs. They compare where people live, how closely they live together, who makes up the population, and how those figures may change. They use the data to explain needs such as housing or school space.
What Mastery Looks Like
- A student can explain why a district with fewer people can still be more densely populated. They use figures from a map and an age chart to explain a likely service need. They treat projections as estimates, not facts.
Common Misconceptions
- Students often confuse total population with density. They may assume everyone in a region is spread evenly across it. They may also read a projected population as a count that has already happened.
How to Assess It
- Exit ticket: District A has 24,000 residents in 4 square miles and is projected to reach 30,000; District B has 30,000 residents in 10 square miles. Calculate each district's current density, then name one planning need A might face if the projection holds.
Lesson moves
Ways to Teach It
Give pairs a 10-square grid and 30 counters; have them cluster or spread the counters, then compare density and distribution.
Show two age pyramids, one with many children and one with many older adults; ask which community may need more classrooms and why.
Play a card match with a density map, age pyramid, and population line graph; students match each to a question it can answer.
On a mock city map with child counts and growth projections, have students place a future school and explain their choice.
Free download
Printable WG.C.2.1 Worksheet
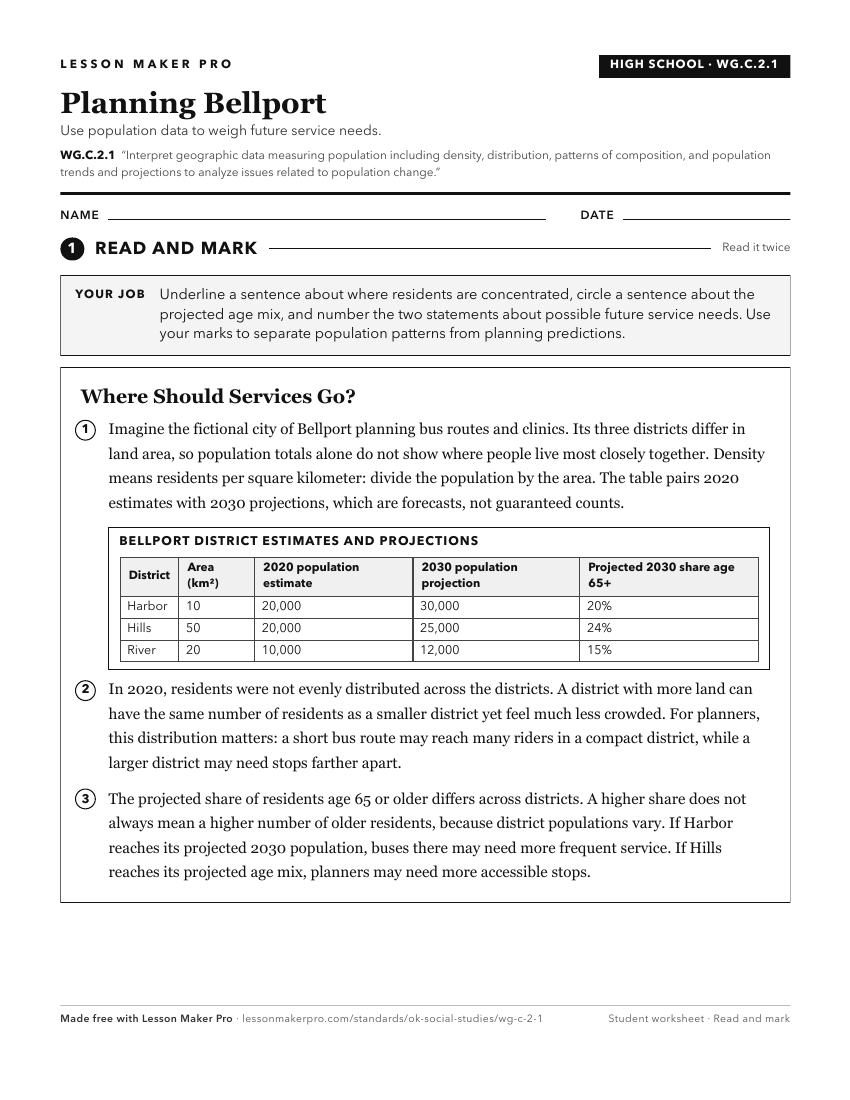
A ready-to-print activity worksheet aligned to WG.C.2.1, with an answer key for the teacher on its own page. No account needed.
PDF, US Letter, prints cleanly in black and white.
Download the worksheetKeep exploring
Related Standards
- 4.C.2.1.B
Use maps and other geographic representations (e.g., globes, charts, graphs) and geographic technologies to draw conclusions (e.g., settlement patterns, populat...
- WG.C.2
Analyze how the human population is organized geographically in order to understand how change affects human systems.
- 6.C.1
Analyze data from a geographic perspective using the skills and tools of geography.
- 7.C.1
Analyze data from a geographic perspective using the skills and tools of geography.
Turn this exact standard into a lesson
Grade, subject, topic, and the complete standard are prefilled. Create one free, no account needed.
Also for this standard:Make a WorksheetMake a QuizMake a Sub Lesson