Oklahoma Social Studies 7.C.1
Standard Cluster
Analyze data from a geographic perspective using the skills and tools of geography. Describe the role of geographic factors on events, explaining the importance of a spatial perspective and the integration of specific geographic information supported by analysis of primary and secondary sources. Reinforce geographic skills through the routine practice and use of geographic tools (e.g., thematic maps, graphs, charts, satellite imagery, GIS technologies) in order to draw conclusions and make predictions from geographic data.
Oklahoma Academic Standards for Social Studies (2026)
Cluster contents
Standards in This Cluster
7.C.1 is a cluster heading. These are the individual standards under it.
- 7.C.1.1
Describe the role of geographic factors on events, explaining the importance of a spatial perspective and the integration of specific geographic information sup...
- 7.C.1.2
Reinforce geographic skills through the routine practice and use of geographic tools (e.g., thematic maps, graphs, charts, satellite imagery, GIS technologies) ...
Teacher's field guide
What This Cluster Means
What Students Need to Do
- Students use maps, satellite images, and graphs to explain how location and physical features affect events. They compare sources, draw conclusions from geographic evidence, and predict what might happen next.
What Mastery Looks Like
- A student reads a map key and identifies places at risk of flooding. They support a prediction with evidence from the map and a dated satellite image, while noting what each source can and cannot show.
Common Misconceptions
- Students may treat map colors as facts without checking the key. They may assume every place near a river floods or mistake an old satellite image for current conditions.
How to Assess It
- Give students a floodplain map with two schools marked and a dated satellite image of the same area. Ask which school faces greater flood risk and what evidence supports their choice.
Lesson moves
Ways to Teach It
Give pairs tracing paper, a river map, and a floodplain map; have them overlay the maps and mark two roads likely to close.
Show a dated satellite image and a flood risk map; ask students which shows direct observations and which shows a prediction.
Run a map-key relay: teams use four thematic maps to find the highest-risk area and cite the symbol behind each choice.
Compare a local bus route map with a floodplain map; have students predict which stops might become hard to reach after heavy rain.
Free download
Printable 7.C.1 Worksheet
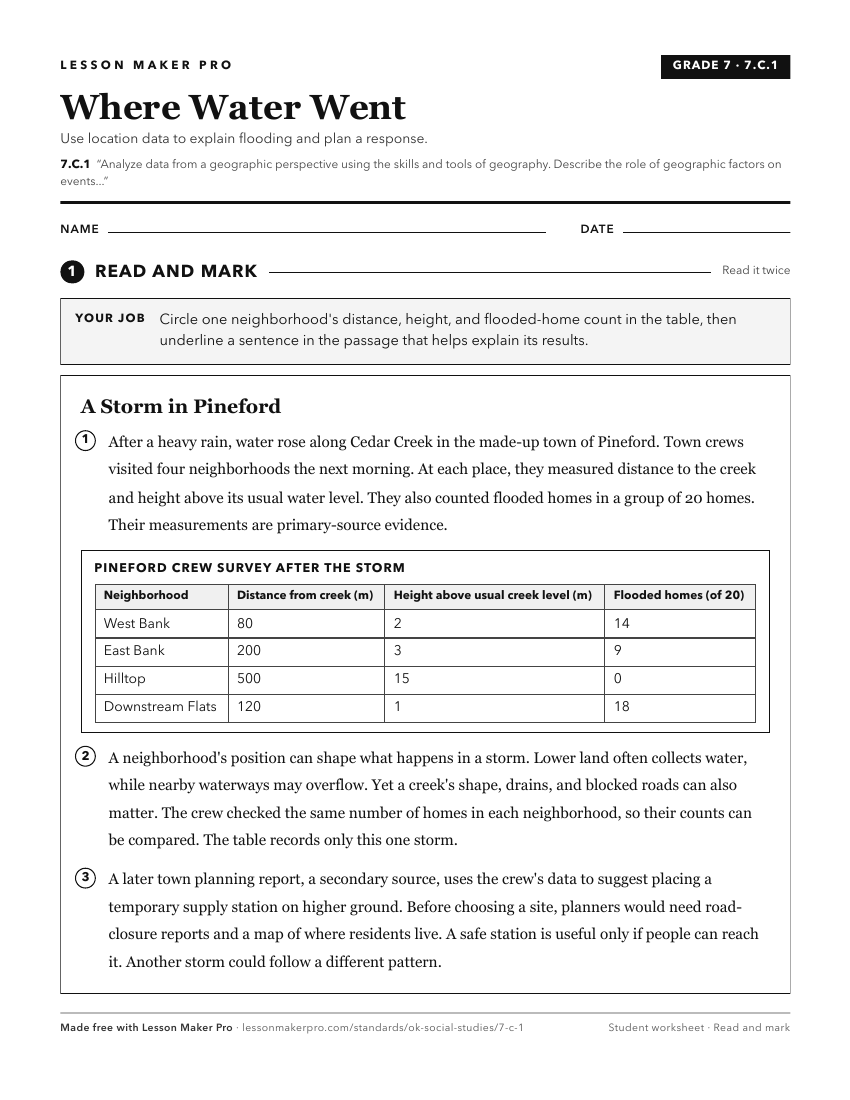
A ready-to-print activity worksheet aligned to 7.C.1, with an answer key for the teacher on its own page. No account needed.
PDF, US Letter, prints cleanly in black and white.
Download the worksheetKeep exploring
Related Standards
- WG.C.1.4
Utilize geographic technologies and geographical data including census data and imagery to draw conclusions about the influence of geography on the world’s peop...
- 4.C.2.1
Use geographic tools to acquire and process information from a spatial perspective.
- 6.C.1
The 6th Grade version of this standard.
- WG.C.1.2
Utilize geographic skills to understand and analyze the spatial organization of people, places, and environments on the Earth’s surface.
Turn this cluster into a lesson
Grade, subject, topic, and the complete cluster are prefilled. Create one free, no account needed.
Also for this cluster:Make a WorksheetMake a QuizMake a Sub Lesson