Oklahoma Math A2.F.1
Standard Cluster
Understand functions as descriptions of covariation (how related quantities vary together). Use algebraic, interval, and set notations to specify the domain and range of various types of functions, and evaluate a function at a given point in its domain. Identify the parent forms of exponential, radical (square root and cube root only), quadratic, and logarithmic functions. Predict the effects of transformations [f(x + c), f(x) + c, f(cx), and cf(x)] algebraically and graphically. Graph a quadratic function. Identify the domain, range, x- and y-intercepts, maximum or minimum value, axis of symmetry, and vertex using various methods and tools that may include a graphing calculator or appropriate technology. Graph exponential and logarithmic functions. Identify the domain, range, asymptotes, and x- and y-intercepts using various methods and tools that may include calculators or other appropriate technology. Recognize exponential decay and growth graphically and algebraically. Analyze the graph of a polynomial function by identifying the domain, range, intercepts, zeros, relative maxima, relative minima, and intervals of increase and decrease. Graph a rational function and identify the domain (including holes), range, x- and y-intercepts, vertical and horizontal asymptotes, using various methods and tools that may include a graphing calculator or other appropriate technology (excluding slant or oblique asymptotes). Graph a radical function (square root and cube root only). Identify the domain, range, and x- and y-intercepts using various methods and tools that may include a graphing calculator or other appropriate technology. Graph piecewise functions with no more than three branches (linear, quadratic, or exponential). Analyze the function by identifying the domain, range, intercepts, and intervals for which it is increasing, decreasing, and constant using various methods and tools (e.g., graphing calculator, other appropriate technology). Recognize whether a discrete or continuous graphical representation is appropriate to create a graph based upon a mathematical model.
Oklahoma Academic Standards for Mathematics (2022)
Cluster contents
Standards in This Cluster
A2.F.1 is a cluster heading. These are the individual standards under it.
- A2.F.1.1
Use algebraic, interval, and set notations to specify the domain and range of various types of functions, and evaluate a function at a given point in its domain...
- A2.F.1.2
Identify the parent forms of exponential, radical (square root and cube root only), quadratic, and logarithmic functions. Predict the effects of transformations...
- A2.F.1.3
Graph a quadratic function. Identify the domain, range, x- and y-intercepts, maximum or minimum value, axis of symmetry, and vertex using various methods and to...
- A2.F.1.4
Graph exponential and logarithmic functions. Identify the domain, range, asymptotes, and x- and y-intercepts using various methods and tools that may include ca...
- A2.F.1.5
Analyze the graph of a polynomial function by identifying the domain, range, intercepts, zeros, relative maxima, relative minima, and intervals of increase and ...
- A2.F.1.6
Graph a rational function and identify the domain (including holes), range, x- and y-intercepts, vertical and horizontal asymptotes, using various methods and t...
- A2.F.1.7
Graph a radical function (square root and cube root only). Identify the domain, range, and x- and y-intercepts using various methods and tools that may include ...
- A2.F.1.8
Graph piecewise functions with no more than three branches (linear, quadratic, or exponential). Analyze the function by identifying the domain, range, intercept...
- A2.F.1.9
Recognize whether a discrete or continuous graphical representation is appropriate to create a graph based upon a mathematical model.
Teacher's field guide
What This Cluster Means
What Students Need to Do
- Track how input and output change together, evaluate functions, and write domain and range in set, interval, and inequality notation. Recognize parent graphs and transformations, then graph quadratic, exponential, logarithmic, radical, polynomial, rational, and piecewise functions. Identify key graph features and decide whether a situation calls for separate points or a connected curve.
What Mastery Looks Like
- Given an equation or graph, a student can evaluate a valid input and state the domain and range with correct endpoints. They can sketch the graph and label intercepts, a vertex or other turning points, holes, asymptotes, and intervals of increase or decrease where relevant. They can explain how a shift or stretch changes the graph.
Common Misconceptions
- Students often swap domain and range or include an excluded input at a hole or vertical asymptote. They may say f(x+3) shifts right or treat 2f(x) as a horizontal stretch. They may connect dots for counts or assume every graph crosses an axis.
How to Assess It
- Exit ticket: For f(x)=-(x-2)²+3, find f(0), the vertex, axis of symmetry, domain, and range. Describe how its graph differs from y=x².
Lesson moves
Ways to Teach It
Use tracing paper to slide y=x² left two squares and up three; students record the new equation and vertex.
Ask why f(x+2) moves a graph left while f(x)+2 moves it up; students explain using the point (1,1) on y=x².
Pairs match graph cards to y=x², y=√x, y=log₂x, y=1/x, and y=2^x; they mark any asymptotes.
Give battery levels of 100%, 80%, 64%, and 51.2% at successive hours; students graph continuous exponential decay.
Free download
Printable A2.F.1 Worksheet
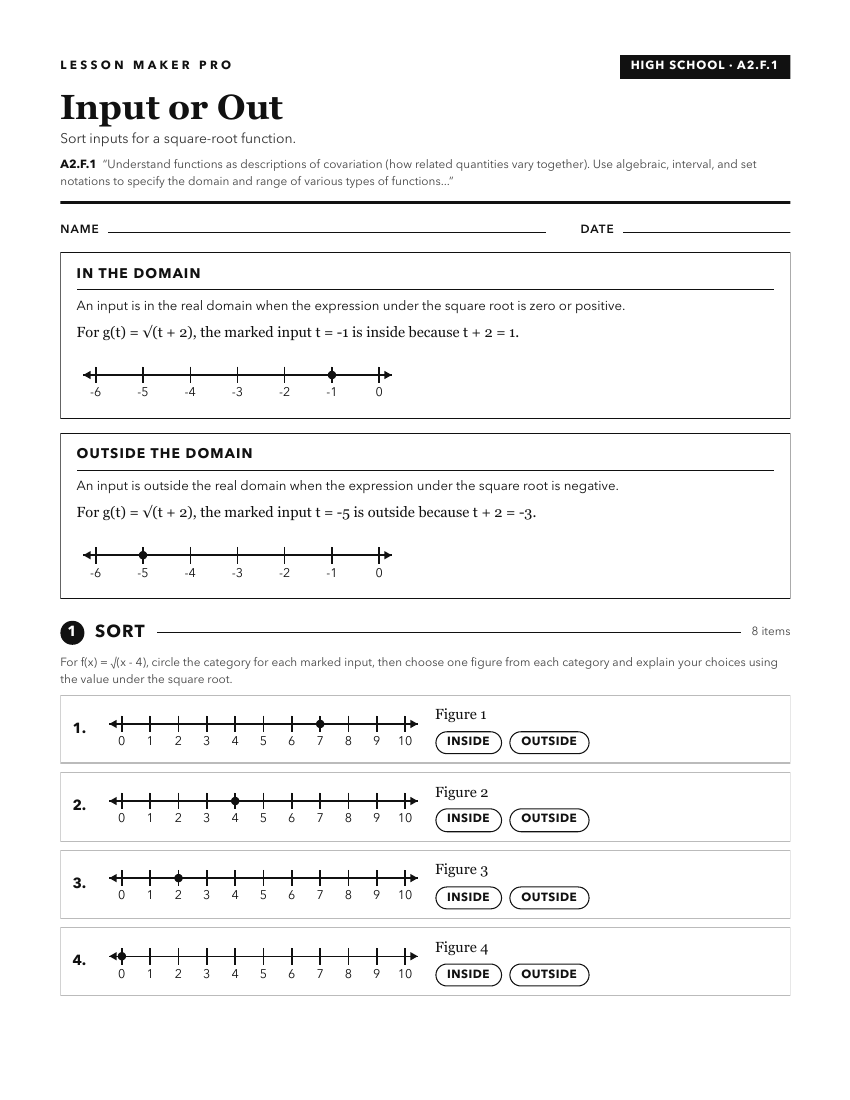
A ready-to-print activity worksheet aligned to A2.F.1, with an answer key for the teacher on its own page. No account needed.
PDF, US Letter, prints cleanly in black and white.
Download the worksheetKeep exploring
Related Standards
- A1.F.1
Understand functions as descriptions of covariation (how related quantities vary together) in real-world and mathematical problems.
- A1.F.2
Recognize and understand that families of functions are defined by their characteristics.
- PC.F.1.3
Interpret characteristics of graphs and tables for a function that models a relationship between two quantities in terms of the quantities.
- PC.F.1
Analyze functions and relations.
Turn this cluster into a lesson
Grade, subject, topic, and the complete cluster are prefilled. Create one free, no account needed.
Also for this cluster:Make a WorksheetMake a QuizMake a Sub Lesson