Oklahoma Math A1.F.1
Standard Cluster
Understand functions as descriptions of covariation (how related quantities vary together) in real-world and mathematical problems. Distinguish between relations and functions. Identify the dependent variable, independent variable, domain and range given a function, equation, or graph. Identify restrictions on the domain and range in mathematical models. Write linear functions, using function notation, to represent mathematical models. Read and interpret the linear piecewise function, given a graph modeling a situation. Interpret graphs as being discrete or continuous.
Oklahoma Academic Standards for Mathematics (2022)
Cluster contents
Standards in This Cluster
A1.F.1 is a cluster heading. These are the individual standards under it.
- A1.F.1.1
Distinguish between relations and functions.
- A1.F.1.2
Identify the dependent variable, independent variable, domain and range given a function, equation, or graph. Identify restrictions on the domain and range in m...
- A1.F.1.3
Write linear functions, using function notation, to represent mathematical models.
- A1.F.1.4
Read and interpret the linear piecewise function, given a graph modeling a situation.
- A1.F.1.5
Interpret graphs as being discrete or continuous.
Teacher's field guide
What This Cluster Means
What Students Need to Do
- Students track how two quantities change together and decide whether each input has exactly one output. They name the input and output and find the domain and range, including real-world limits. They write linear rules in function notation and read piecewise graphs, deciding whether values between plotted points make sense.
What Mastery Looks Like
- Given a $4 fee plus $2 per mile, a student writes C(m)=4+2m, with m≥0 and C≥4. They name miles as the input and cost as the output, and reject a relation that gives one input two outputs. They explain what happens during each part of a piecewise graph and whether the graph is discrete or continuous.
Common Misconceptions
- Students may think every relation is a function or mistake the vertical axis for the input. They may include negative time or impossible costs in a model's domain or range. They may connect dots for counts of people or mistake a change in slope for a sudden jump.
How to Assess It
- Exit ticket: A fair charges $3 to enter and $2 per ride, with up to four rides. Write C(r), list its domain and range, and say whether its graph should connect the plotted points.
Lesson moves
Ways to Teach It
Give students ordered-pair cards, including (2, 5) and (2, 8); have them build arrow diagrams and identify which sets are functions.
Sketch a tank's water level rising, holding steady, then falling; ask, 'What happens during each part of the graph?'
Play a domain-and-range relay: post four graphs and have teams list possible x- and y-values for each.
Use a $2-per-ride bus fare for up to five rides; students write C(r)=2r and list allowed inputs and outputs.
Free download
Printable A1.F.1 Worksheet
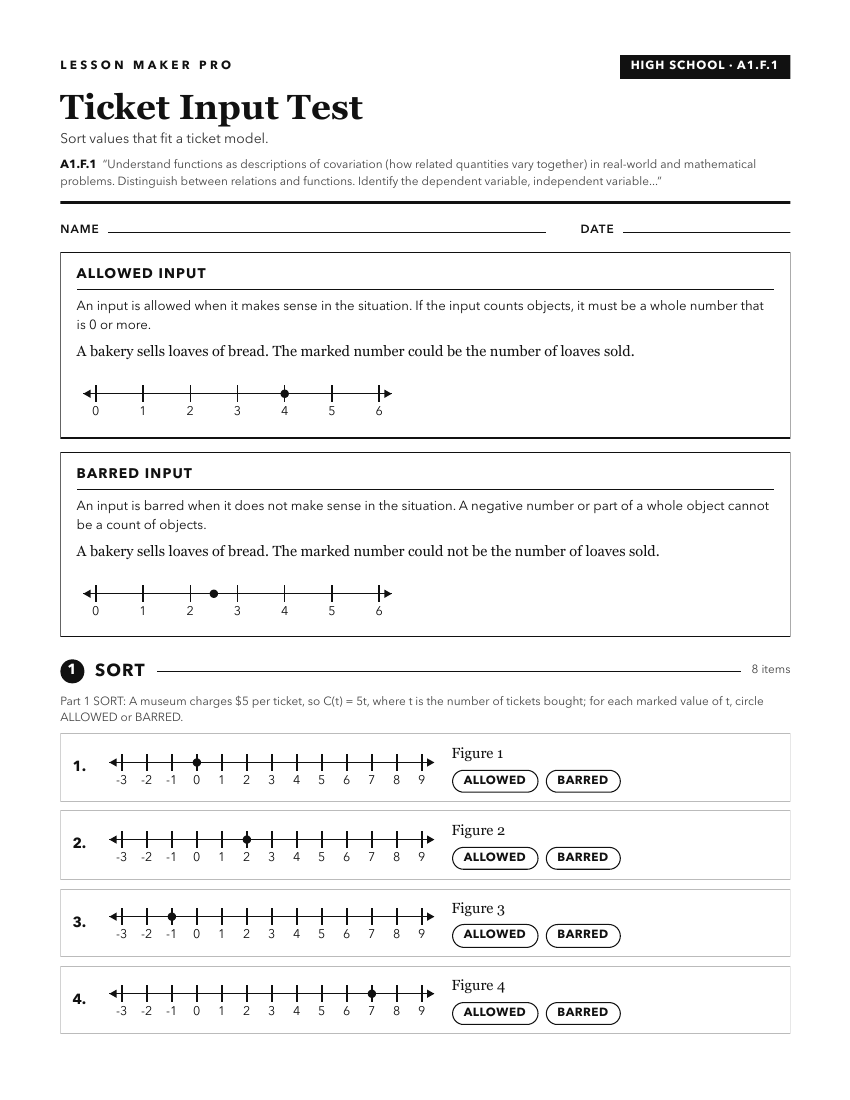
A ready-to-print activity worksheet aligned to A1.F.1, with an answer key for the teacher on its own page. No account needed.
PDF, US Letter, prints cleanly in black and white.
Download the worksheetKeep exploring
Related Standards
- A2.F.1
Understand functions as descriptions of covariation (how related quantities vary together).
- PA.A.1.2
Use linear functions to represent and model mathematical situations.
- 2.A.1
Describe the relationship found in patterns to solve real-world and mathematical problems.
- PC.F.1.3
Interpret characteristics of graphs and tables for a function that models a relationship between two quantities in terms of the quantities.
Turn this cluster into a lesson
Grade, subject, topic, and the complete cluster are prefilled. Create one free, no account needed.
Also for this cluster:Make a WorksheetMake a QuizMake a Sub Lesson