Oklahoma Math A1.F.1.4
The Standard
- A1.F.1
- Understand functions as descriptions of covariation (how related quantities vary together) in real-world and mathematical problems.
Read and interpret the linear piecewise function, given a graph modeling a situation.
Oklahoma Academic Standards for Mathematics (2022)
Teacher's field guide
What This Standard Means
What Students Need to Do
- Students read a graph made of straight segments and tell what each part means in the situation. They use the axis labels to find values, compare rates of change, and explain what happens at each corner.
What Mastery Looks Like
- A student can find the amount at a named time and say when it rises, stays steady, or falls. They can describe the rate on each segment with units and explain what each corner means.
Common Misconceptions
- Students may read a flat segment as time stopping, rather than the measured amount staying the same. They may mistake the height of a segment for its rate or overlook a change in rate at a corner.
How to Assess It
- Draw a water-volume graph with minutes on the x-axis and liters on the y-axis, connecting (0,0), (4,12), (6,12), and (9,6). Ask: “What happens from minute 4 to 6, and how fast does the volume change from minute 6 to 9?”
Lesson moves
Ways to Teach It
Use a measuring cup to add water to a clear container, pause, then remove water; students sketch a volume-time graph.
Show a tank graph with a rise, flat stretch, and fall; ask, “When does the tank drain, and how can you tell?”
Give pairs cards with segmented graphs and event descriptions; have them match cards and explain each corner.
Give students a distance-from-home graph for a walk with a stop and return; have them mark the stop and compare speeds.
Free download
Printable A1.F.1.4 Worksheet
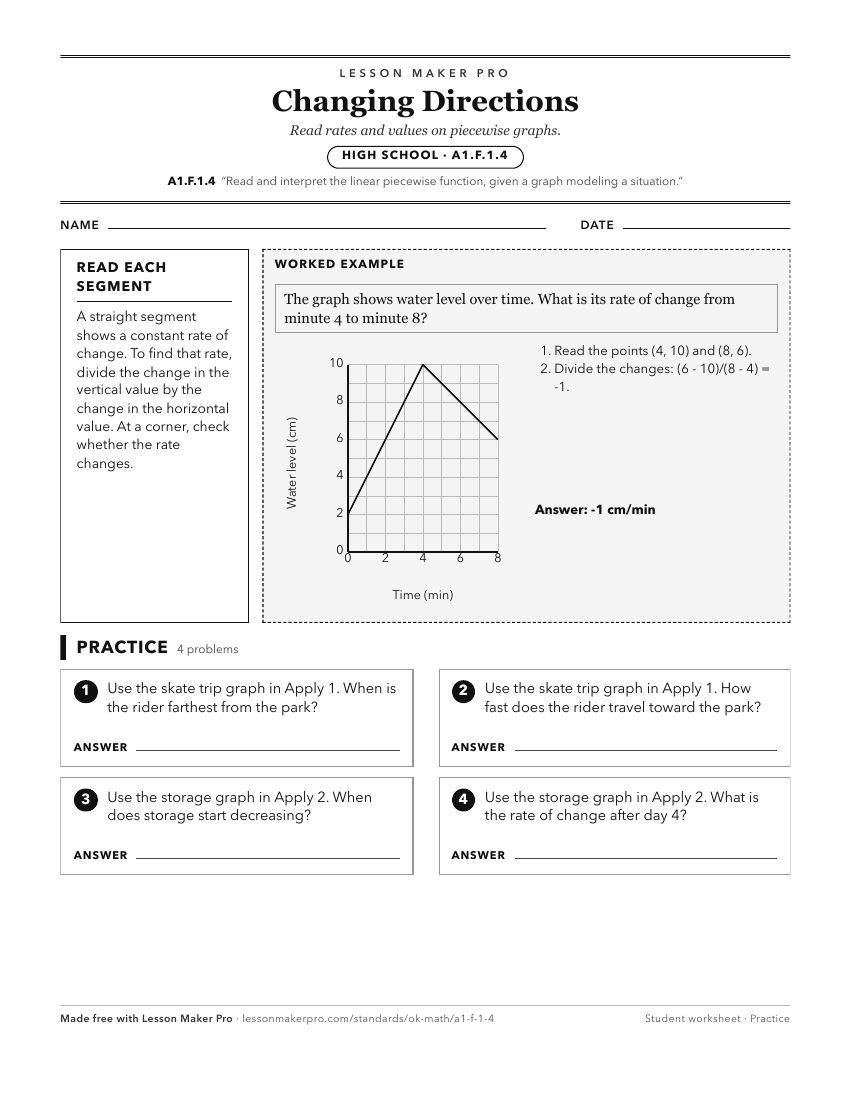
A ready-to-print activity worksheet aligned to A1.F.1.4, with an answer key for the teacher on its own page. No account needed.
PDF, US Letter, prints cleanly in black and white.
Download the worksheetKeep exploring
Related Standards
- PA.A.1.2
Use linear functions to represent and model mathematical situations.
- A1.A.2.1
Represent relationships using mathematical models with linear inequalities; solve the resulting inequalities, graph on a coordinate plane, and interpret the sol...
- PA.A.2.5
Solve problems involving linear functions and interpret results in the original context.
- A2.F.1.8
Graph piecewise functions with no more than three branches (linear, quadratic, or exponential). Analyze the function by identifying the domain, range, intercept...
Turn this exact standard into a lesson
Grade, subject, topic, and the complete standard are prefilled. Create one free, no account needed.
Also for this standard:Make a WorksheetMake a QuizMake a Sub Lesson