Oklahoma Math A2.F.1.8
The Standard
- A2.F.1
- Understand functions as descriptions of covariation (how related quantities vary together).
Graph piecewise functions with no more than three branches (linear, quadratic, or exponential). Analyze the function by identifying the domain, range, intercepts, and intervals for which it is increasing, decreasing, and constant using various methods and tools (e.g., graphing calculator, other appropriate technology).
Oklahoma Academic Standards for Mathematics (2022)
Teacher's field guide
What This Standard Means
What Students Need to Do
- Students graph up to three pieces, using each rule only on its assigned interval. They mark open and closed endpoints. They find the domain, range, intercepts, and intervals where the graph rises, falls, or stays flat.
What Mastery Looks Like
- A student graphs linear, quadratic, and exponential pieces on the correct intervals. They mark endpoints correctly and identify the domain, range, and intercepts. They name increasing, decreasing, and constant intervals, including changes within a quadratic piece.
Common Misconceptions
- Students may extend a piece beyond its assigned interval or include an open endpoint. They may mix up domain and range or miss a quadratic turning point when naming intervals.
How to Assess It
- Exit ticket: Graph f(x)=x+1 for x<0 and f(x)=2 for x≥0. Give its domain, range, intercepts, and intervals of increase, decrease, and constancy.
Lesson moves
Ways to Teach It
On a printed grid, use colored string for y=x+1 on x<0 and y=2 on x≥0; mark open and closed endpoints with stickers.
Ask: Why is 1 missing from the range of y=x+1 on x<0, while 2 is included for y=2 on x≥0?
Play branch match: pair graph cards with y=x+1 on x<0, y=(x−1)² on 0≤x≤2, and y=2ˣ on x>2.
Graph a parking fee: $5 for 0 to 1 hour, then $3 more per extra hour through hour 4; label flat and rising intervals.
Free download
Printable A2.F.1.8 Worksheet
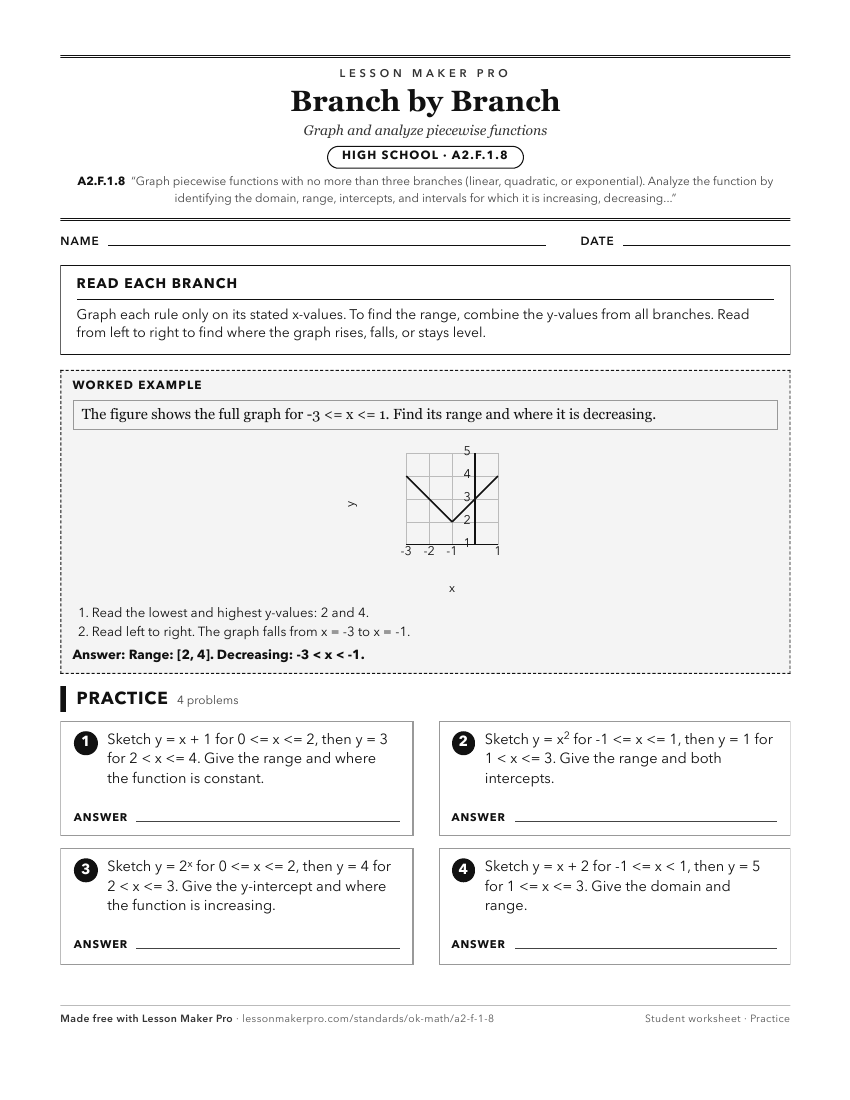
A ready-to-print activity worksheet aligned to A2.F.1.8, with an answer key for the teacher on its own page. No account needed.
PDF, US Letter, prints cleanly in black and white.
Download the worksheetKeep exploring
Related Standards
- A2.F.1.5
Analyze the graph of a polynomial function by identifying the domain, range, intercepts, zeros, relative maxima, relative minima, and intervals of increase and ...
- A2.F.1.3
Graph a quadratic function. Identify the domain, range, x- and y-intercepts, maximum or minimum value, axis of symmetry, and vertex using various methods and to...
- A2.F.1.4
Graph exponential and logarithmic functions. Identify the domain, range, asymptotes, and x- and y-intercepts using various methods and tools that may include ca...
- A1.F.1.4
Read and interpret the linear piecewise function, given a graph modeling a situation.
Turn this exact standard into a lesson
Grade, subject, topic, and the complete standard are prefilled. Create one free, no account needed.
Also for this standard:Make a WorksheetMake a QuizMake a Sub Lesson