Oklahoma Math A2.F.1.5
The Standard
- A2.F.1
- Understand functions as descriptions of covariation (how related quantities vary together).
Analyze the graph of a polynomial function by identifying the domain, range, intercepts, zeros, relative maxima, relative minima, and intervals of increase and decrease.
Oklahoma Academic Standards for Mathematics (2022)
Teacher's field guide
What This Standard Means
What Students Need to Do
- Students read a polynomial graph to find its domain, range, intercepts, and zeros. They locate local highs and lows and name the x-intervals where the graph rises or falls.
What Mastery Looks Like
- Students give intercepts as points and zeros as x-values. They state that the domain is all real numbers and use the graph’s end behavior to find the range. They give increasing and decreasing intervals with correct endpoints.
Common Misconceptions
- Students may give the visible window as the domain, even though a polynomial continues left and right forever. They may confuse zeros with y-intercepts or call a graph increasing because its y-values are positive. They may include a turning point inside an interval of increase or decrease.
How to Assess It
- Give students a graph of y=(x²−1)² with axes marked in units of 1. Ask them to list its domain, range, intercepts, zeros, relative highs and lows, and increasing and decreasing intervals.
Lesson moves
Ways to Teach It
Plot points for y=(x²−1)² on graph paper, draw a smooth curve, then mark intercepts and turning points with colored dots.
Show the graph of y=(x−1)² and ask, “Can a zero occur without crossing the x-axis? Explain.”
Match graphs of y=x², y=−x², y=x³, and y=(x²−1)² to cards showing ranges, zeros, and increasing intervals.
Graph h(t)=−5t²+20t for a tossed ball over 0 to 4 seconds; mark its peak and when it rises or falls.
Free download
Printable A2.F.1.5 Worksheet
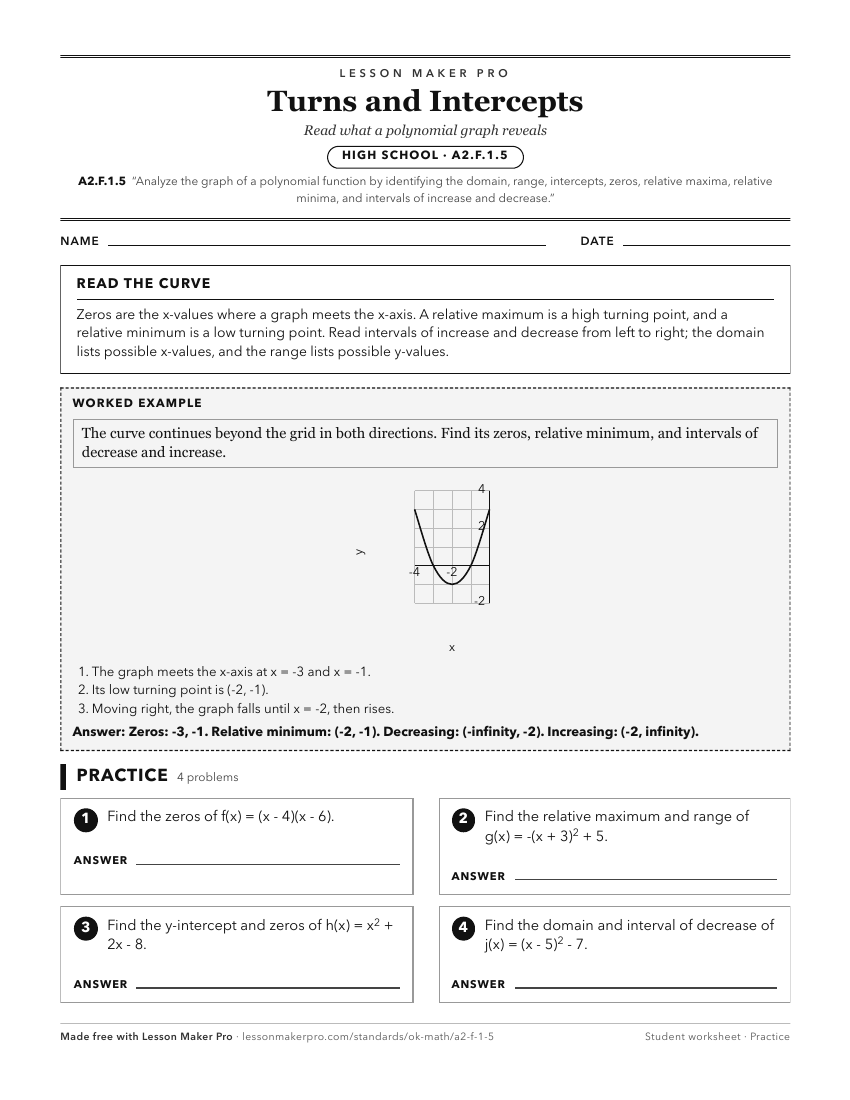
A ready-to-print activity worksheet aligned to A2.F.1.5, with an answer key for the teacher on its own page. No account needed.
PDF, US Letter, prints cleanly in black and white.
Download the worksheetKeep exploring
Related Standards
- A2.F.1.8
Graph piecewise functions with no more than three branches (linear, quadratic, or exponential). Analyze the function by identifying the domain, range, intercept...
- A2.F.1.3
Graph a quadratic function. Identify the domain, range, x- and y-intercepts, maximum or minimum value, axis of symmetry, and vertex using various methods and to...
- A2.F.1.6
Graph a rational function and identify the domain (including holes), range, x- and y-intercepts, vertical and horizontal asymptotes, using various methods and t...
- A2.F.1.4
Graph exponential and logarithmic functions. Identify the domain, range, asymptotes, and x- and y-intercepts using various methods and tools that may include ca...
Turn this exact standard into a lesson
Grade, subject, topic, and the complete standard are prefilled. Create one free, no account needed.
Also for this standard:Make a WorksheetMake a QuizMake a Sub Lesson