Oklahoma Math A2.F.1.4
The Standard
- A2.F.1
- Understand functions as descriptions of covariation (how related quantities vary together).
Graph exponential and logarithmic functions. Identify the domain, range, asymptotes, and x- and y-intercepts using various methods and tools that may include calculators or other appropriate technology. Recognize exponential decay and growth graphically and algebraically.
Oklahoma Academic Standards for Mathematics (2022)
Teacher's field guide
What This Standard Means
What Students Need to Do
- Students sketch exponential and logarithmic graphs from equations, tables, or a graphing tool. They find intercepts, allowed inputs and outputs, and lines the curves approach. They tell exponential growth from decay using the graph or the base.
What Mastery Looks Like
- For y=2^x-4, a student marks (0,-3), (2,0), and the asymptote y=-4. They give all real inputs and outputs above -4. For y=log₂(x-1), they give inputs greater than 1, all real outputs, the asymptote x=1, and no y-intercept.
Common Misconceptions
- Students may mark y=0 as the asymptote even after a graph shifts up or down. They may try to take the log of zero to find a y-intercept. Some call a graph decay just because it lies below the x-axis.
How to Assess It
- Give students y=(1/2)^x+1 and y=log₂(x-1). Ask them to sketch both, mark intercepts and asymptotes, give the domain and range, and identify the exponential decay graph.
Lesson moves
Ways to Teach It
Build piles of 1, 2, 4, and 8 counters, plot (step, pile size), then swap coordinates to sketch a logarithmic graph.
Ask students to explain in writing why y=log₂(x-3) has no y-intercept but does have an x-intercept.
Give pairs cards showing equations, graphs, domains, and asymptotes; have them match each set and explain one match.
Plot a $100 item's value after it loses 20% each year for five years, then compare the points with V=100(0.8)^t.
Free download
Printable A2.F.1.4 Worksheet
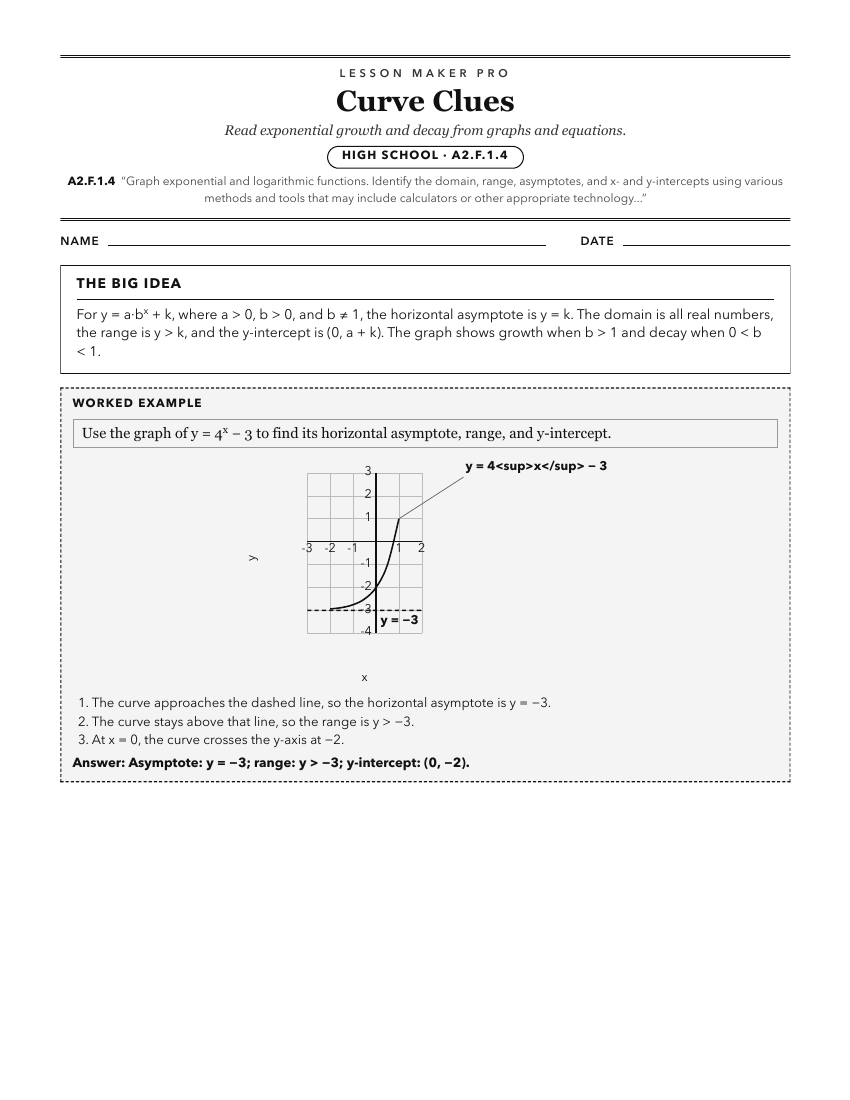
A ready-to-print activity worksheet aligned to A2.F.1.4, with an answer key for the teacher on its own page. No account needed.
PDF, US Letter, prints cleanly in black and white.
Download the worksheetKeep exploring
Related Standards
- A2.F.1.6
Graph a rational function and identify the domain (including holes), range, x- and y-intercepts, vertical and horizontal asymptotes, using various methods and t...
- A2.F.1.3
Graph a quadratic function. Identify the domain, range, x- and y-intercepts, maximum or minimum value, axis of symmetry, and vertex using various methods and to...
- A2.F.1.7
Graph a radical function (square root and cube root only). Identify the domain, range, and x- and y-intercepts using various methods and tools that may include ...
- A2.F.1.8
Graph piecewise functions with no more than three branches (linear, quadratic, or exponential). Analyze the function by identifying the domain, range, intercept...
Turn this exact standard into a lesson
Grade, subject, topic, and the complete standard are prefilled. Create one free, no account needed.
Also for this standard:Make a WorksheetMake a QuizMake a Sub Lesson