Oklahoma Math PC.F.1.3
The Standard
- PC.F.1
- Analyze functions and relations.
Interpret characteristics of graphs and tables for a function that models a relationship between two quantities in terms of the quantities.
Oklahoma Academic Standards for Mathematics (2022)
Teacher's field guide
What This Standard Means
What Students Need to Do
- Students read a graph or table as a story about two quantities. They explain what starting values, peaks, and rising, falling, or flat stretches mean, using the quantities and units.
What Mastery Looks Like
- Given a graph or table of water volume over time, students identify the starting volume and greatest shown volume, with units. They explain when the volume rises, falls, or stays constant and what that means for the tank.
Common Misconceptions
- Students may confuse the time of a peak with the amount at that peak. They may read a flat stretch as zero water instead of no change in water. In a table, they may look only at the time column when finding the greatest volume.
How to Assess It
- Draw a line graph of tank volume in liters against time in minutes, joining (0,10), (1,15), (2,15), and (3,8). Ask: “When is the volume greatest, and what does the flat segment mean?”
Lesson moves
Ways to Teach It
Add 100 mL of water to a clear jar each minute, record the volume in a table, and graph volume against time.
Show a graph of students in a cafeteria line versus time; ask what its highest point and a flat segment mean.
Give pairs tank volume graphs with rising, falling, and flat segments; have them match each segment to filling, draining, or waiting.
Give a table of bus distance from school at five times; ask which listed time shows the greatest distance and where distance decreased.
Free download
Printable PC.F.1.3 Worksheet
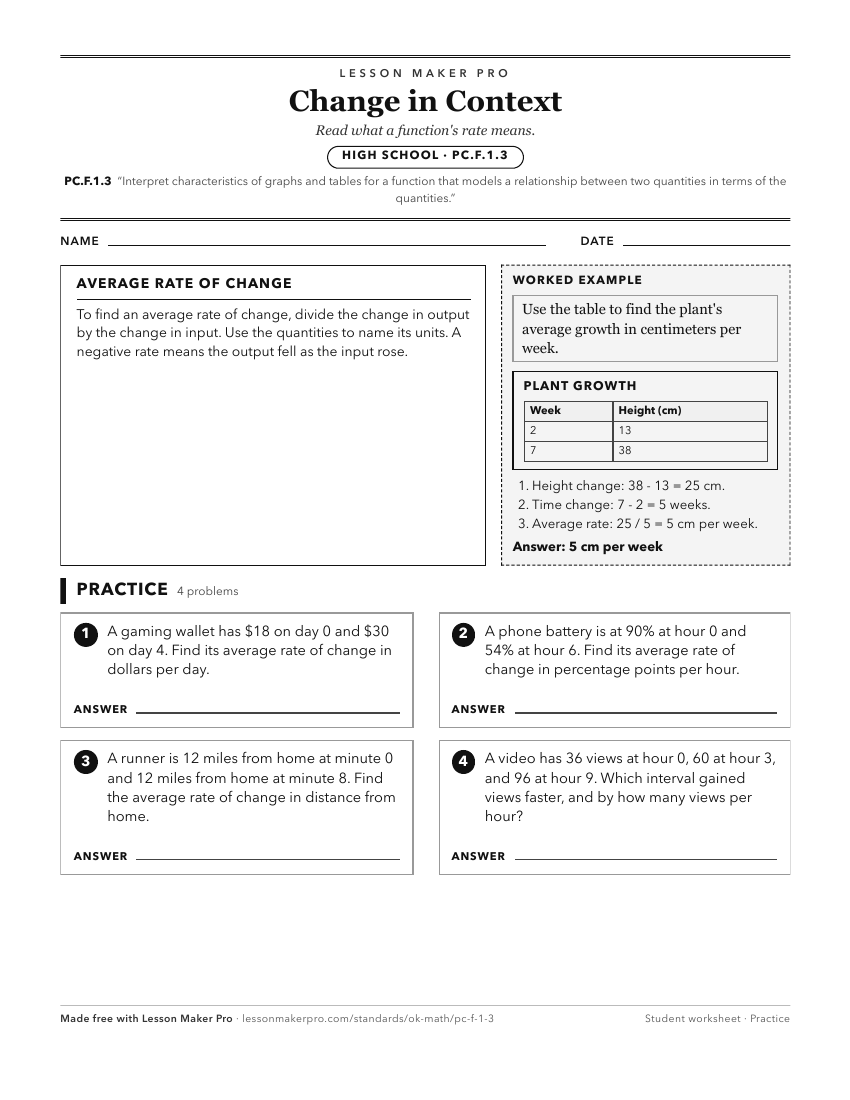
A ready-to-print activity worksheet aligned to PC.F.1.3, with an answer key for the teacher on its own page. No account needed.
PDF, US Letter, prints cleanly in black and white.
Download the worksheetKeep exploring
Related Standards
- PC.F.1.2
Sketch the graph of a function that models a relationship between two quantities, identifying key features.
- 6.A.1.2
Represent relationships between two varying positive quantities involving no more than two operations with rules, graphs, and tables; translate between any two ...
- 7.A.2.1
Represent proportional relationships with tables, verbal descriptions, symbols, and graphs; translate from one representation to another. Determine and compare ...
- PA.A.2.1
Represent linear functions with tables, verbal descriptions, symbols, and graphs; translate from one representation to another.
Turn this exact standard into a lesson
Grade, subject, topic, and the complete standard are prefilled. Create one free, no account needed.
Also for this standard:Make a WorksheetMake a QuizMake a Sub Lesson