Oklahoma Math PC.F.1.2
The Standard
- PC.F.1
- Analyze functions and relations.
Sketch the graph of a function that models a relationship between two quantities, identifying key features.
Oklahoma Academic Standards for Mathematics (2022)
Teacher's field guide
What This Standard Means
What Students Need to Do
- Students turn a description of two changing quantities into a graph. They label the axes and show where the graph rises, falls, stays flat, or reaches a high or low point.
What Mastery Looks Like
- Given a tank that fills, stays full, and then drains, a student sketches those changes in the right order. They label time and water volume and explain what the highest point means.
Common Misconceptions
- Students may draw a picture of the scene instead of a graph of two quantities. They may swap the axes, miss a flat stretch, or extend the graph past the time in the story.
How to Assess It
- Exit ticket: A 10-gallon tank starts empty, fills steadily for 4 minutes, stays full for 2 minutes, then drains to empty over 5 minutes. Sketch gallons versus minutes, label the axes, and circle the maximum.
Lesson moves
Ways to Teach It
Pour water into a marked container for 30 seconds, then wait 10 seconds; students sketch water volume versus time.
Ask, “If a runner stops at a water station, what happens to a distance-versus-time graph?” Have students draw and explain the flat section.
Give pairs story cards for a filling tank, a draining tank, a parked car, and a walk home; match each to a labeled graph.
Show a $4 taxi starting fare plus $2 per mile; students sketch total cost against miles and explain the intercept.
Free download
Printable PC.F.1.2 Worksheet
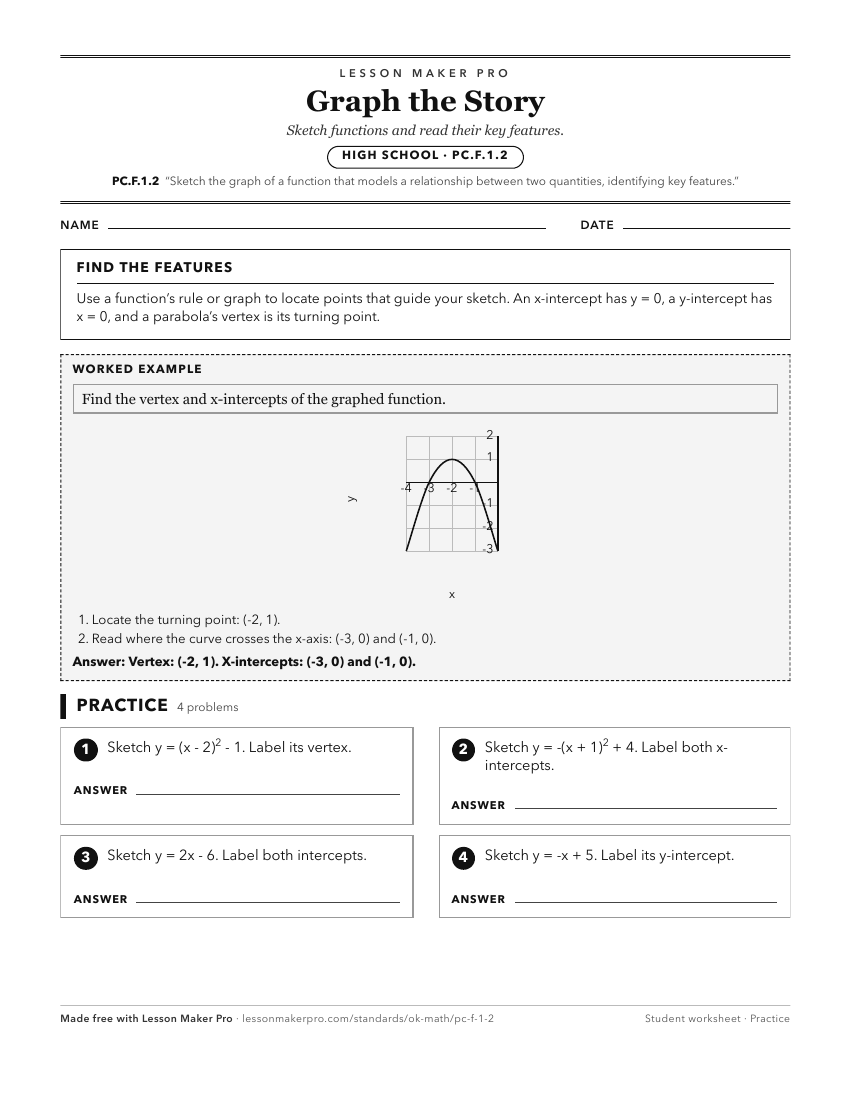
A ready-to-print activity worksheet aligned to PC.F.1.2, with an answer key for the teacher on its own page. No account needed.
PDF, US Letter, prints cleanly in black and white.
Download the worksheetKeep exploring
Related Standards
- PC.F.1.3
Interpret characteristics of graphs and tables for a function that models a relationship between two quantities in terms of the quantities.
- PC.CS.1.3
Sketch a graph of a conic section using its key features.
- A2.D.1.2
Collect data and use scatter plots to analyze patterns and describe linear, exponential, or quadratic relationships between two variables.
- A2.F.1.9
Recognize whether a discrete or continuous graphical representation is appropriate to create a graph based upon a mathematical model.
Turn this exact standard into a lesson
Grade, subject, topic, and the complete standard are prefilled. Create one free, no account needed.
Also for this standard:Make a WorksheetMake a QuizMake a Sub Lesson