Oklahoma Math A2.D.1.2
The Standard
- A2.D.1
- Display, describe, and compare data. For linear and nonlinear relationships, make predictions and assess the reliability of those predictions.
Collect data and use scatter plots to analyze patterns and describe linear, exponential, or quadratic relationships between two variables.
Oklahoma Academic Standards for Mathematics (2022)
Teacher's field guide
What This Standard Means
What Students Need to Do
- Students collect paired measurements and plot them on a scatter plot. They use the shape and the changes between points to decide whether a linear, exponential, or quadratic model fits.
What Mastery Looks Like
- A student labels axes with units, plots pairs accurately, and spots the pattern despite a stray point. They support their model choice with roughly steady differences, ratios, or second differences, then make a prediction near the measured range.
Common Misconceptions
- Students may connect points in collection order instead of plotting each pair by its coordinates. They may call any upward curve exponential, even when the second differences are roughly steady. They may trust a prediction far beyond the measured values.
How to Assess It
- Give students the pairs (1, 2), (2, 5), (3, 10), and (4, 17). Ask them to plot the points, name the pattern, predict the value at 5, and justify their answer using the changes between values.
Lesson moves
Ways to Teach It
Build tile squares with sides 1 through 5, count the tiles, record side length and area, then plot the pairs.
Show plots of y = 2x and y = 2^x for x from 1 to 4; ask partners which has steady differences and which has steady ratios.
Match cards showing scatter plots, value tables, and model names; explain each match using differences or ratios.
Plot a $100 savings balance at 10% annual interest for five years, then predict year six and discuss a changed interest rate.
Free download
Printable A2.D.1.2 Worksheet
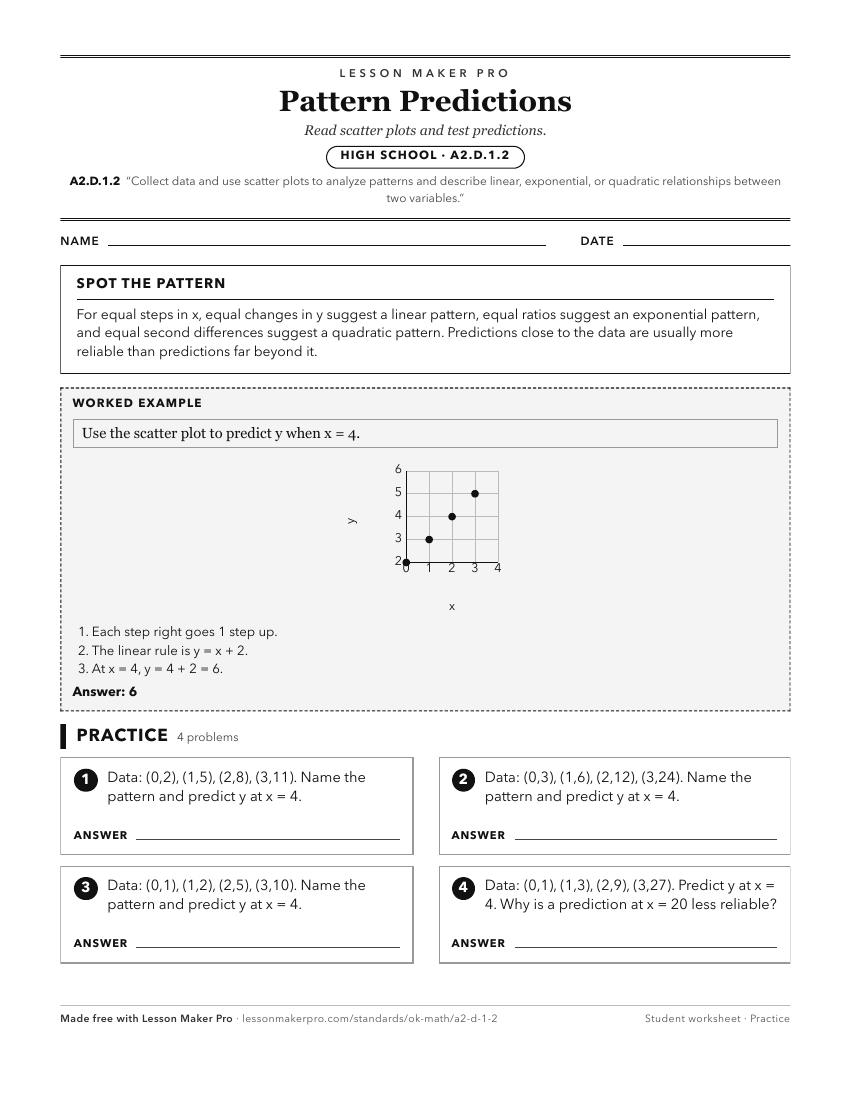
A ready-to-print activity worksheet aligned to A2.D.1.2, with an answer key for the teacher on its own page. No account needed.
PDF, US Letter, prints cleanly in black and white.
Download the worksheetKeep exploring
Related Standards
- A1.D.1.2
Collect data and analyze scatter plots for patterns, linearity, and outliers.
- PA.D.1.3
Collect, display, and interpret data using scatter plots. Use the shape of the scatter plot to find the informal line of best fit, make statements about the ave...
- A2.D.1
Display, describe, and compare data. For linear and nonlinear relationships, make predictions and assess the reliability of those predictions.
- A1.D.1
Display, describe, and compare data. For linear relationships, make predictions, and assess the reliability of those predictions.
Turn this exact standard into a lesson
Grade, subject, topic, and the complete standard are prefilled. Create one free, no account needed.
Also for this standard:Make a WorksheetMake a QuizMake a Sub Lesson