Oklahoma Math PA.D.1.3
The Standard
- PA.D.1
- Display and interpret data in a variety of ways, including using scatter plots and approximate lines of best fit. Use the line of best fit and average rate of change to make predictions and draw conclusions about data.
Collect, display, and interpret data using scatter plots. Use the shape of the scatter plot to find the informal line of best fit, make statements about the average rate of change, and make predictions about values not in the original data set. Use appropriate titles, labels, and units.
Oklahoma Academic Standards for Mathematics (2022)
Teacher's field guide
What This Standard Means
What Students Need to Do
- Students collect paired measurements and plot each pair as one point. They add a title and label both axes with units. They describe the pattern, sketch a line through a roughly straight cluster, estimate its rate of change, and predict an unmeasured value.
What Mastery Looks Like
- On a plot of practice hours and free throws made, a student draws a line through the middle of the points. They describe its slope in made shots per hour and use the line to predict a result for six hours. They know a prediction far beyond the plotted hours is less reliable.
Common Misconceptions
- Students may connect the dots in order instead of drawing a line through the middle of the cluster. They may read the line's height as its rate of change or leave units off the axes. Some use a straight line to predict from a curved pattern.
How to Assess It
- Give students the pairs (1,3), (2,5), (3,6), (4,9), and (5,10), where x is practice hours and y is free throws made out of 15. Ask for a titled, labeled scatter plot, a fit line, its approximate rate in made shots per hour, and a prediction for six hours.
Lesson moves
Ways to Teach It
Have pairs measure classmates' hand spans and heights in centimeters, then plot the measurements on graph paper with labeled axes.
Show a scatter plot of study hours and quiz scores; ask, "What does the slope of a fit line mean here?"
Give teams eight practice-hour and free-throw data cards; have them plot, draw a fit line, and compare predictions for six hours.
Plot temperature and lemonade sales from a small table, then use a fit line to predict sales at an unlisted temperature.
Free download
Printable PA.D.1.3 Worksheet
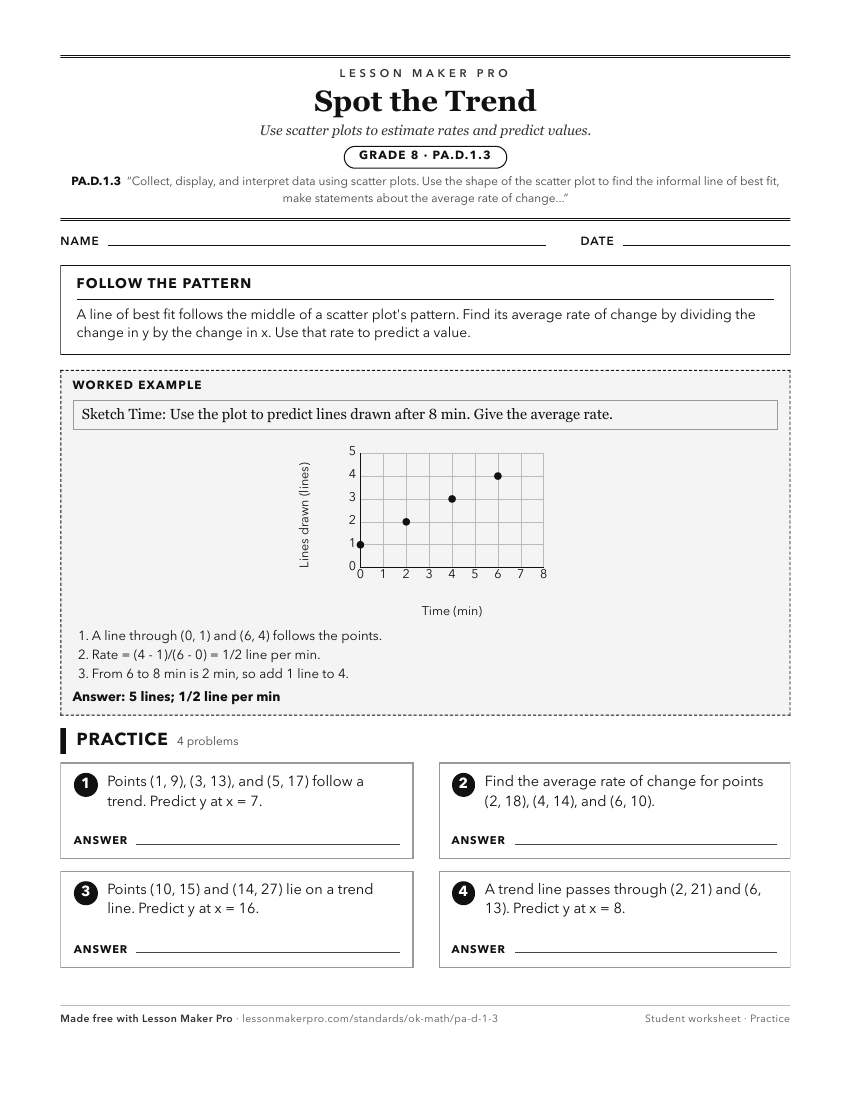
A ready-to-print activity worksheet aligned to PA.D.1.3, with an answer key for the teacher on its own page. No account needed.
PDF, US Letter, prints cleanly in black and white.
Download the worksheetKeep exploring
Related Standards
- PA.D.1
Display and interpret data in a variety of ways, including using scatter plots and approximate lines of best fit. Use the line of best fit and average rate of c...
- A2.D.1.2
Collect data and use scatter plots to analyze patterns and describe linear, exponential, or quadratic relationships between two variables.
- A1.D.1.2
Collect data and analyze scatter plots for patterns, linearity, and outliers.
- A1.D.1
Display, describe, and compare data. For linear relationships, make predictions, and assess the reliability of those predictions.
Turn this exact standard into a lesson
Grade, subject, topic, and the complete standard are prefilled. Create one free, no account needed.
Also for this standard:Make a WorksheetMake a QuizMake a Sub Lesson