Oklahoma Math PA.D.1
Standard Cluster
Display and interpret data in a variety of ways, including using scatter plots and approximate lines of best fit. Use the line of best fit and average rate of change to make predictions and draw conclusions about data. Describe the impact that inserting or deleting a data point has on the mean and the median of a data set. Create data displays using technology to examine this impact. Explain how outliers affect measures of center and spread. Collect, display, and interpret data using scatter plots. Use the shape of the scatter plot to find the informal line of best fit, make statements about the average rate of change, and make predictions about values not in the original data set. Use appropriate titles, labels, and units.
Oklahoma Academic Standards for Mathematics (2022)
Cluster contents
Standards in This Cluster
PA.D.1 is a cluster heading. These are the individual standards under it.
- PA.D.1.1
Describe the impact that inserting or deleting a data point has on the mean and the median of a data set. Create data displays using technology to examine this ...
- PA.D.1.2
Explain how outliers affect measures of center and spread.
- PA.D.1.3
Collect, display, and interpret data using scatter plots. Use the shape of the scatter plot to find the informal line of best fit, make statements about the ave...
Teacher's field guide
What This Cluster Means
What Students Need to Do
- Students make labeled scatter plots and sketch a line through the trend. They use its slope to describe average change and predict other values. They use a spreadsheet to check how added or removed points change the mean, median, and spread.
What Mastery Looks Like
- A student labels both axes with units and draws a line that balances the points. They estimate its rate of change and use it to predict a new value. They explain how adding or removing an extreme value changes the mean, median, and range.
Common Misconceptions
- Students connect points in order instead of drawing one trend line. They confuse the slope with a predicted value or leave units off the axes. They expect an outlier to move the median as much as the mean, or miss its effect on the range.
How to Assess It
- Exit ticket: Plot taxi trips (miles, dollars) (1,4), (2,7), (3,8), (4,11), (5,14); label axes, fit a line, estimate its rate, and predict a 6-mile fare. Add a $40 fare and compare the mean, median, and range before and after.
Lesson moves
Ways to Teach It
Measure classmates' heights and arm spans in centimeters, enter the pairs in a spreadsheet, and sketch a line on the scatter plot.
Make a spreadsheet dot plot for 4, 6, 6, 8, 10; add 50, then explain changes in mean, median, and range.
Give pairs (1,5), (2,8), (3,8), (4,11); award one point each for a fit line, slope estimate, and prediction at 5.
Graph electricity bills of $35, $43, $51, and $59 at 100, 200, 300, and 400 kWh; predict the bill at 500 kWh.
Free download
Printable PA.D.1 Worksheet
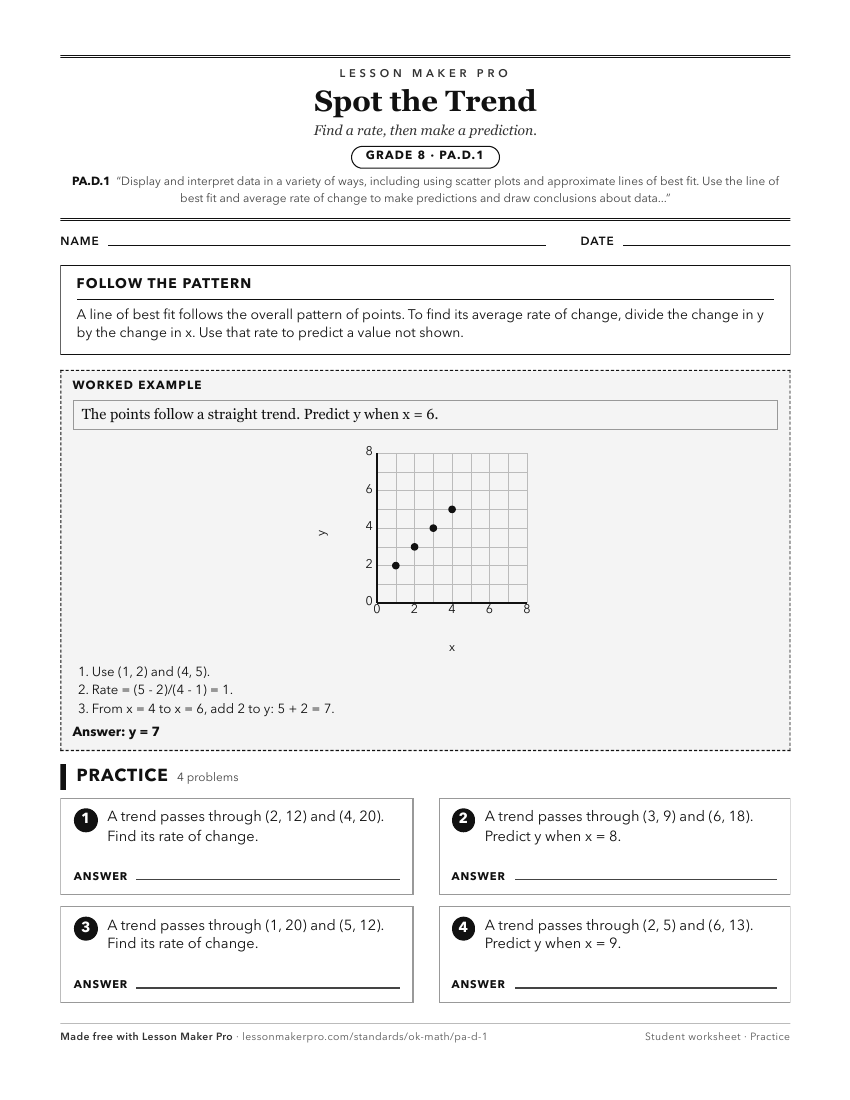
A ready-to-print activity worksheet aligned to PA.D.1, with an answer key for the teacher on its own page. No account needed.
PDF, US Letter, prints cleanly in black and white.
Download the worksheetKeep exploring
Related Standards
- A2.D.1
Display, describe, and compare data. For linear and nonlinear relationships, make predictions and assess the reliability of those predictions.
- A1.D.1
Display, describe, and compare data. For linear relationships, make predictions, and assess the reliability of those predictions.
- A2.D.1.2
Collect data and use scatter plots to analyze patterns and describe linear, exponential, or quadratic relationships between two variables.
Turn this cluster into a lesson
Grade, subject, topic, and the complete cluster are prefilled. Create one free, no account needed.
Also for this cluster:Make a WorksheetMake a QuizMake a Sub Lesson